Barclays Investment Banking Pitch Book
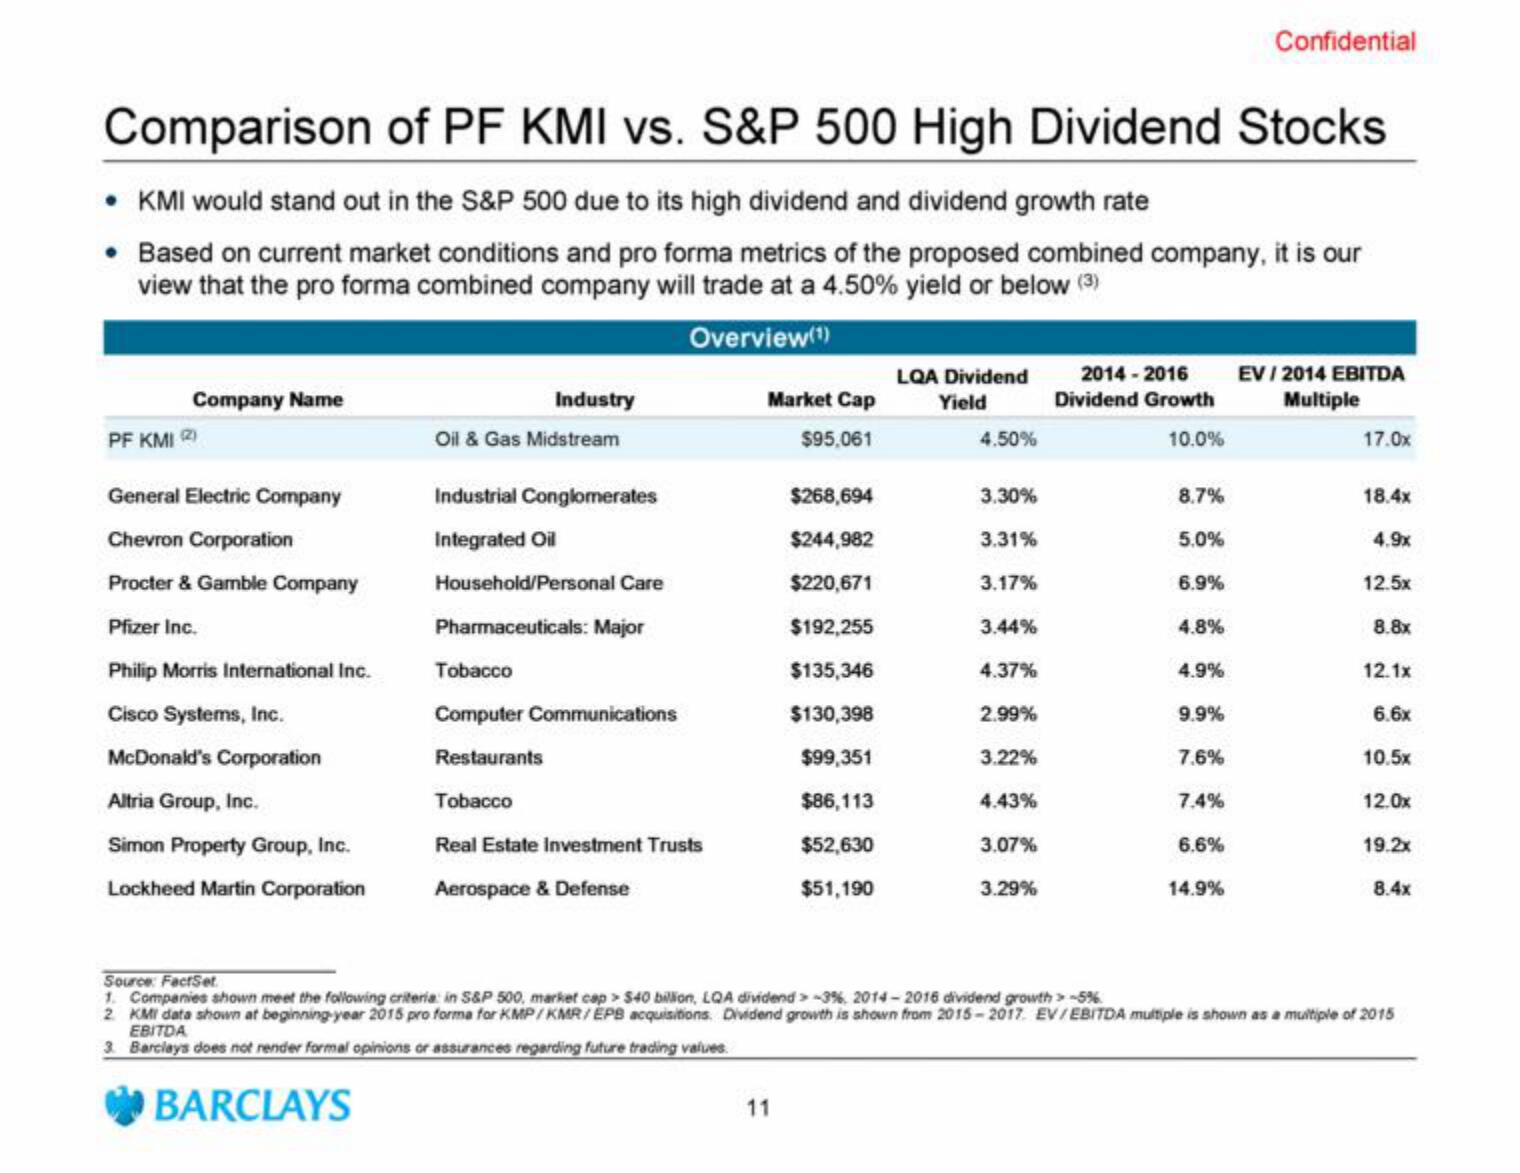
Comparison of PF KMI vs. S&P 500 High Dividend Stocks
• KMI would stand out in the S&P 500 due to its high dividend and dividend growth rate
• Based on current market conditions and pro forma metrics of the proposed combined company, it is our
view that the pro forma combined company will trade at a 4.50% yield or below (3)
Overview(¹)
Company Name
PF KMI 2
General Electric Company
Chevron Corporation
Procter & Gamble Company
Pfizer Inc.
Philip Morris International Inc.
Cisco Systems, Inc.
McDonald's Corporation
Altria Group, Inc.
Simon Property Group, Inc.
Lockheed Martin Corporation
Industry
Oil & Gas Midstream
Industrial Conglomerates
Integrated Oil
Household/Personal Care
Pharmaceuticals: Major
Tobacco
Computer Communications
Restaurants
Tobacco
Real Estate Investment Trusts
Aerospace & Defense
Market Cap
$95,061
$268,694
$244,982
$220,671
$192,255
$135,346
$130,398
$99,351
$86,113
$52,630
$51,190
11
LQA Dividend
Yield
4.50%
3.30%
3.31%
3.17%
3.44%
4.37%
2.99%
3.22%
4.43%
3.07%
3.29%
2014-2016
Dividend Growth
10.0%
8.7%
5.0%
6.9%
4.8%
4.9%
9.9%
7.6%
7.4%
6.6%
Confidential
14.9%
EV / 2014 EBITDA
Multiple
17.0x
18.4x
4.9x
12.5x
8.8x
12.1x
6.6x
10.5×
12.0x
19.2x
8.4x
Source: FactSet
1. Companies shown meet the following criteria in S&P 500, market cap> $40 billion, LQA dividend -3%, 2014-2016 dividend growth > -5%
2 KMI data shown at beginning year 2015 pro forma for KMP/KMR/EPS acquisitions. Dividend growth is shown from 2015-2017 EV/EBITDA multiple is shown as a multiple of 2015
EBITDA
3. Barclays does not render formal opinions or assurances regarding future trading values.
BARCLAYSView entire presentation