TPG Results Presentation Deck
Other Operating Metrics
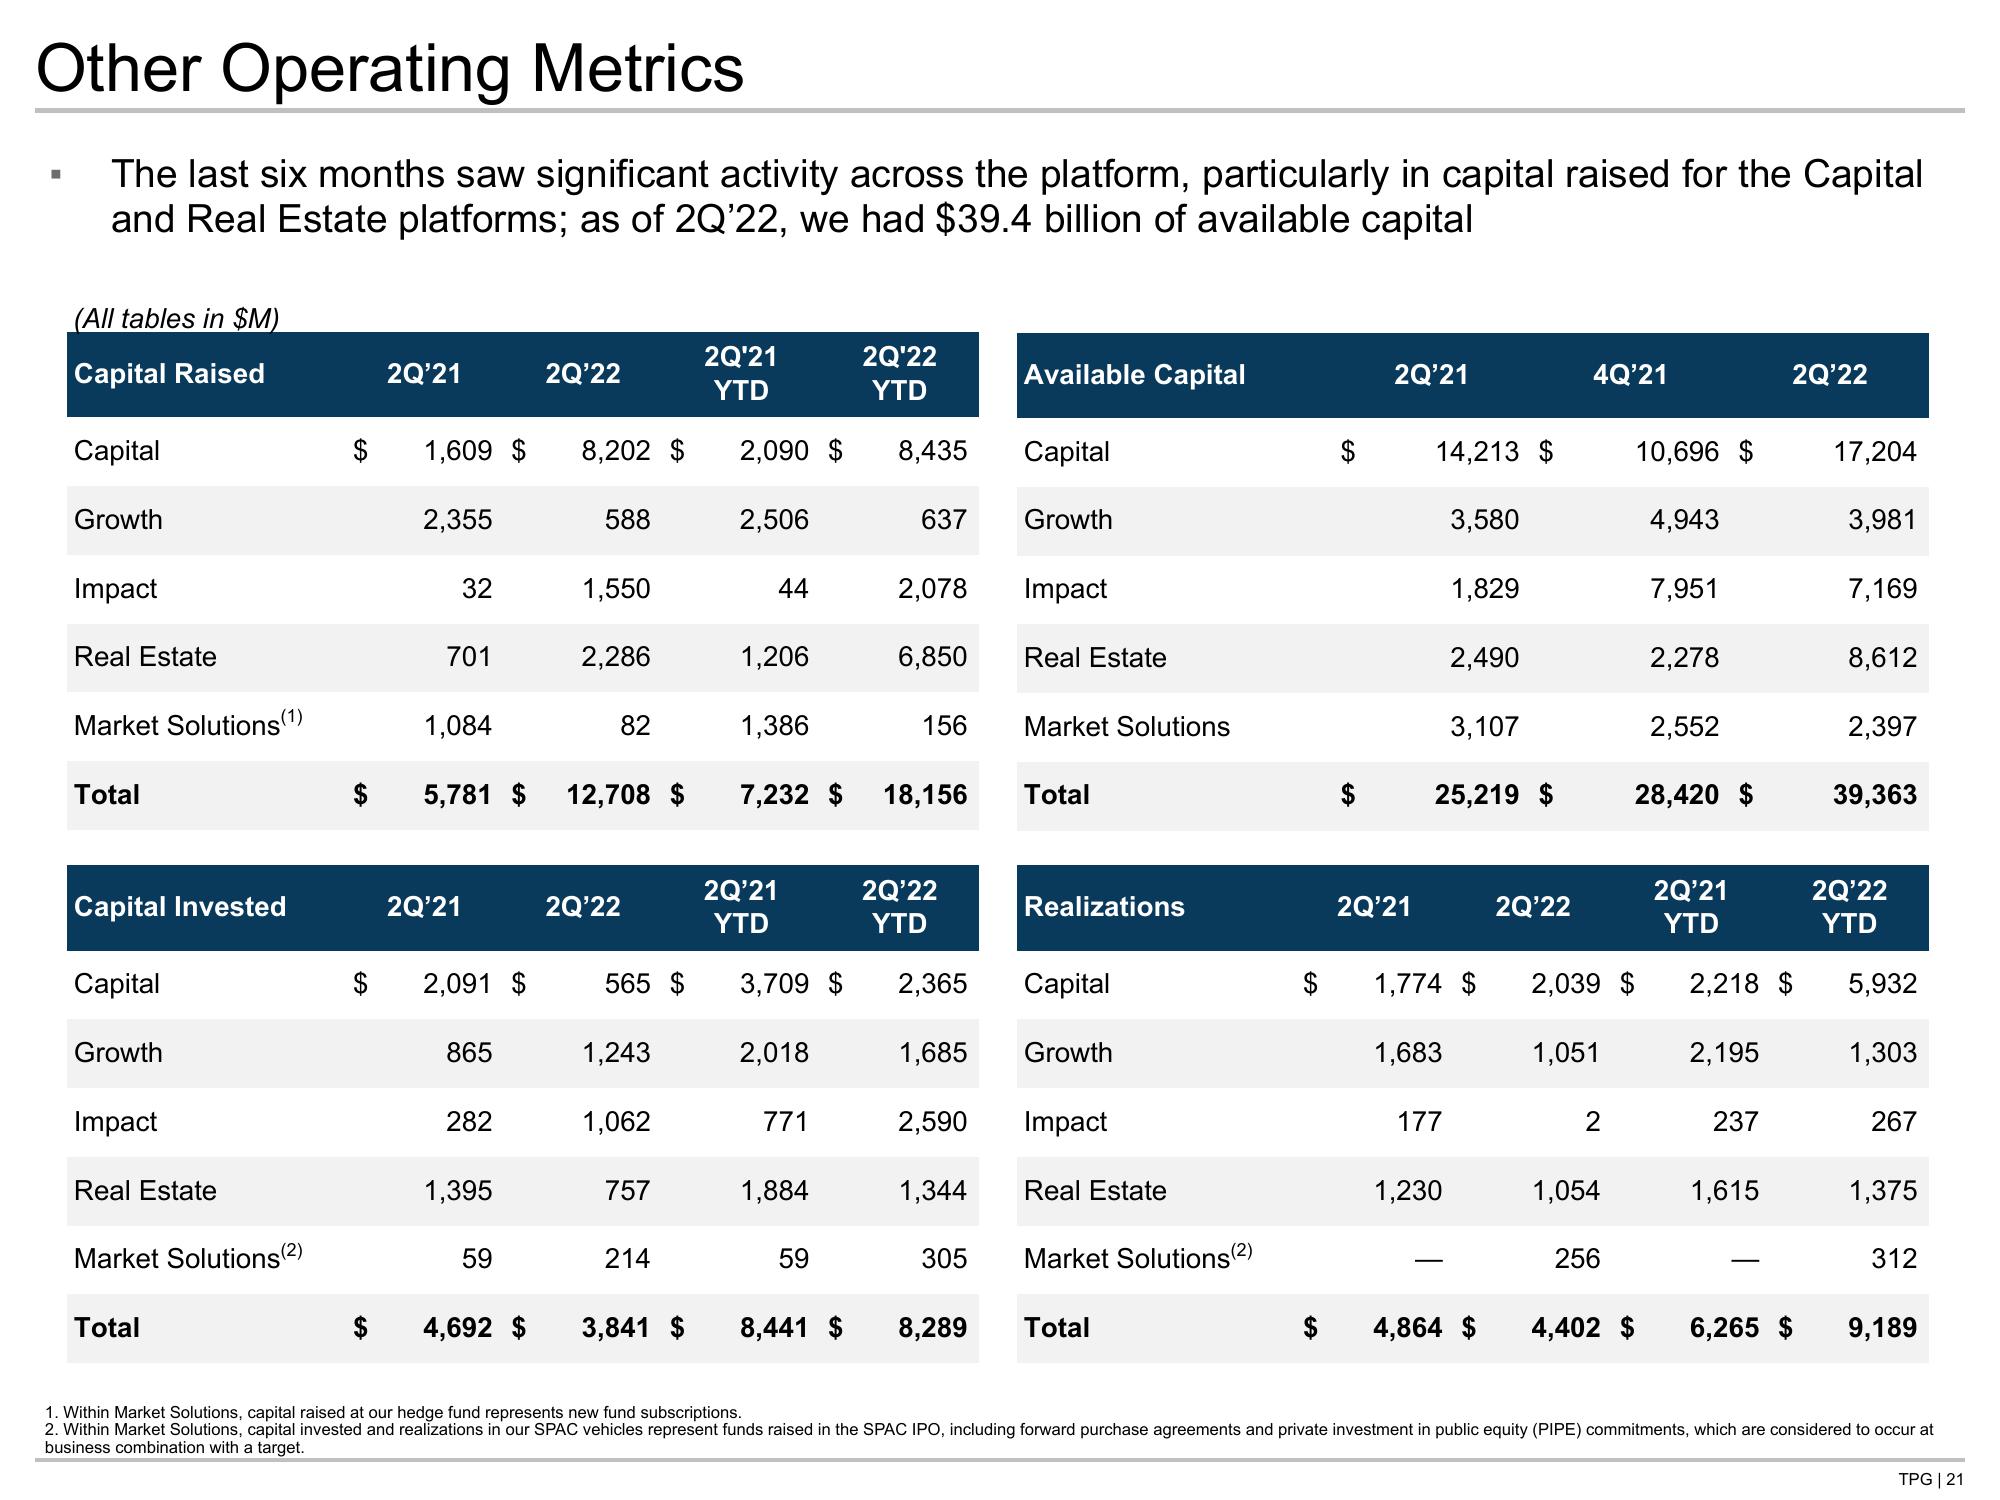
The last six months saw significant activity across the platform, particularly in capital raised for the Capital
and Real Estate platforms; as of 2Q'22, we had $39.4 billion of available capital
(All tables in $M)
Capital Raised
Capital
Growth
Impact
Real Estate
Market Solutions (1)
Total
Capital Invested
Capital
Growth
Impact
Real Estate
Market Solutions (²)
Total
2Q'21
1,609 $ 8,202 $
2,355
32
701
1,084
2Q'21
2,091 $
865
5,781 $ 12,708 $
282
2Q'22
1,395
59
588
1,550
2,286
82
2Q'22
565 $
1,243
1,062
757
214
4,692 $ 3,841 $
2Q'21
YTD
2,090 $
2,506
44
1,206
1,386
7,232 $
2Q'21
YTD
3,709 $
2,018
771
1,884
59
8,441 $
2Q'22
YTD
8,435
637
2,078
6,850
156
18,156
2Q'22
YTD
2,365
1,685
1,344
305
Available Capital
8,289
Capital
Growth
Impact
Real Estate
Market Solutions
Total
Realizations
2,590 Impact
Capital
Growth
Real Estate
Market Solutions (2)
Total
2Q'21
2Q'21
14,213 $
1,683
3,580
177
1,829
25,219 $
1,230
2,490
3,107
$ 1,774 $ 2,039 $
2Q'22
4,864 $
4Q'21
1,051
1,054
256
10,696 $
4,943
7,951
2,278
2,552
28,420 $
2Q'21
YTD
2,218 $
2,195
237
2Q'22
1,615
4,402 $ 6,265 $
17,204
3,981
7,169
8,612
2,397
39,363
2Q'22
YTD
5,932
1,303
267
1,375
312
9,189
1. Within Market Solutions, capital raised at our hedge fund represents new fund subscriptions.
2. Within Market Solutions, capital invested and realizations in our SPAC vehicles represent funds raised in the SPAC IPO, including forward purchase agreements and private investment in public equity (PIPE) commitments, which are considered to occur at
business combination with a target.
TPG | 21View entire presentation