Meyer Burger Investor Presentation
Balance sheet
MEYER BURGER
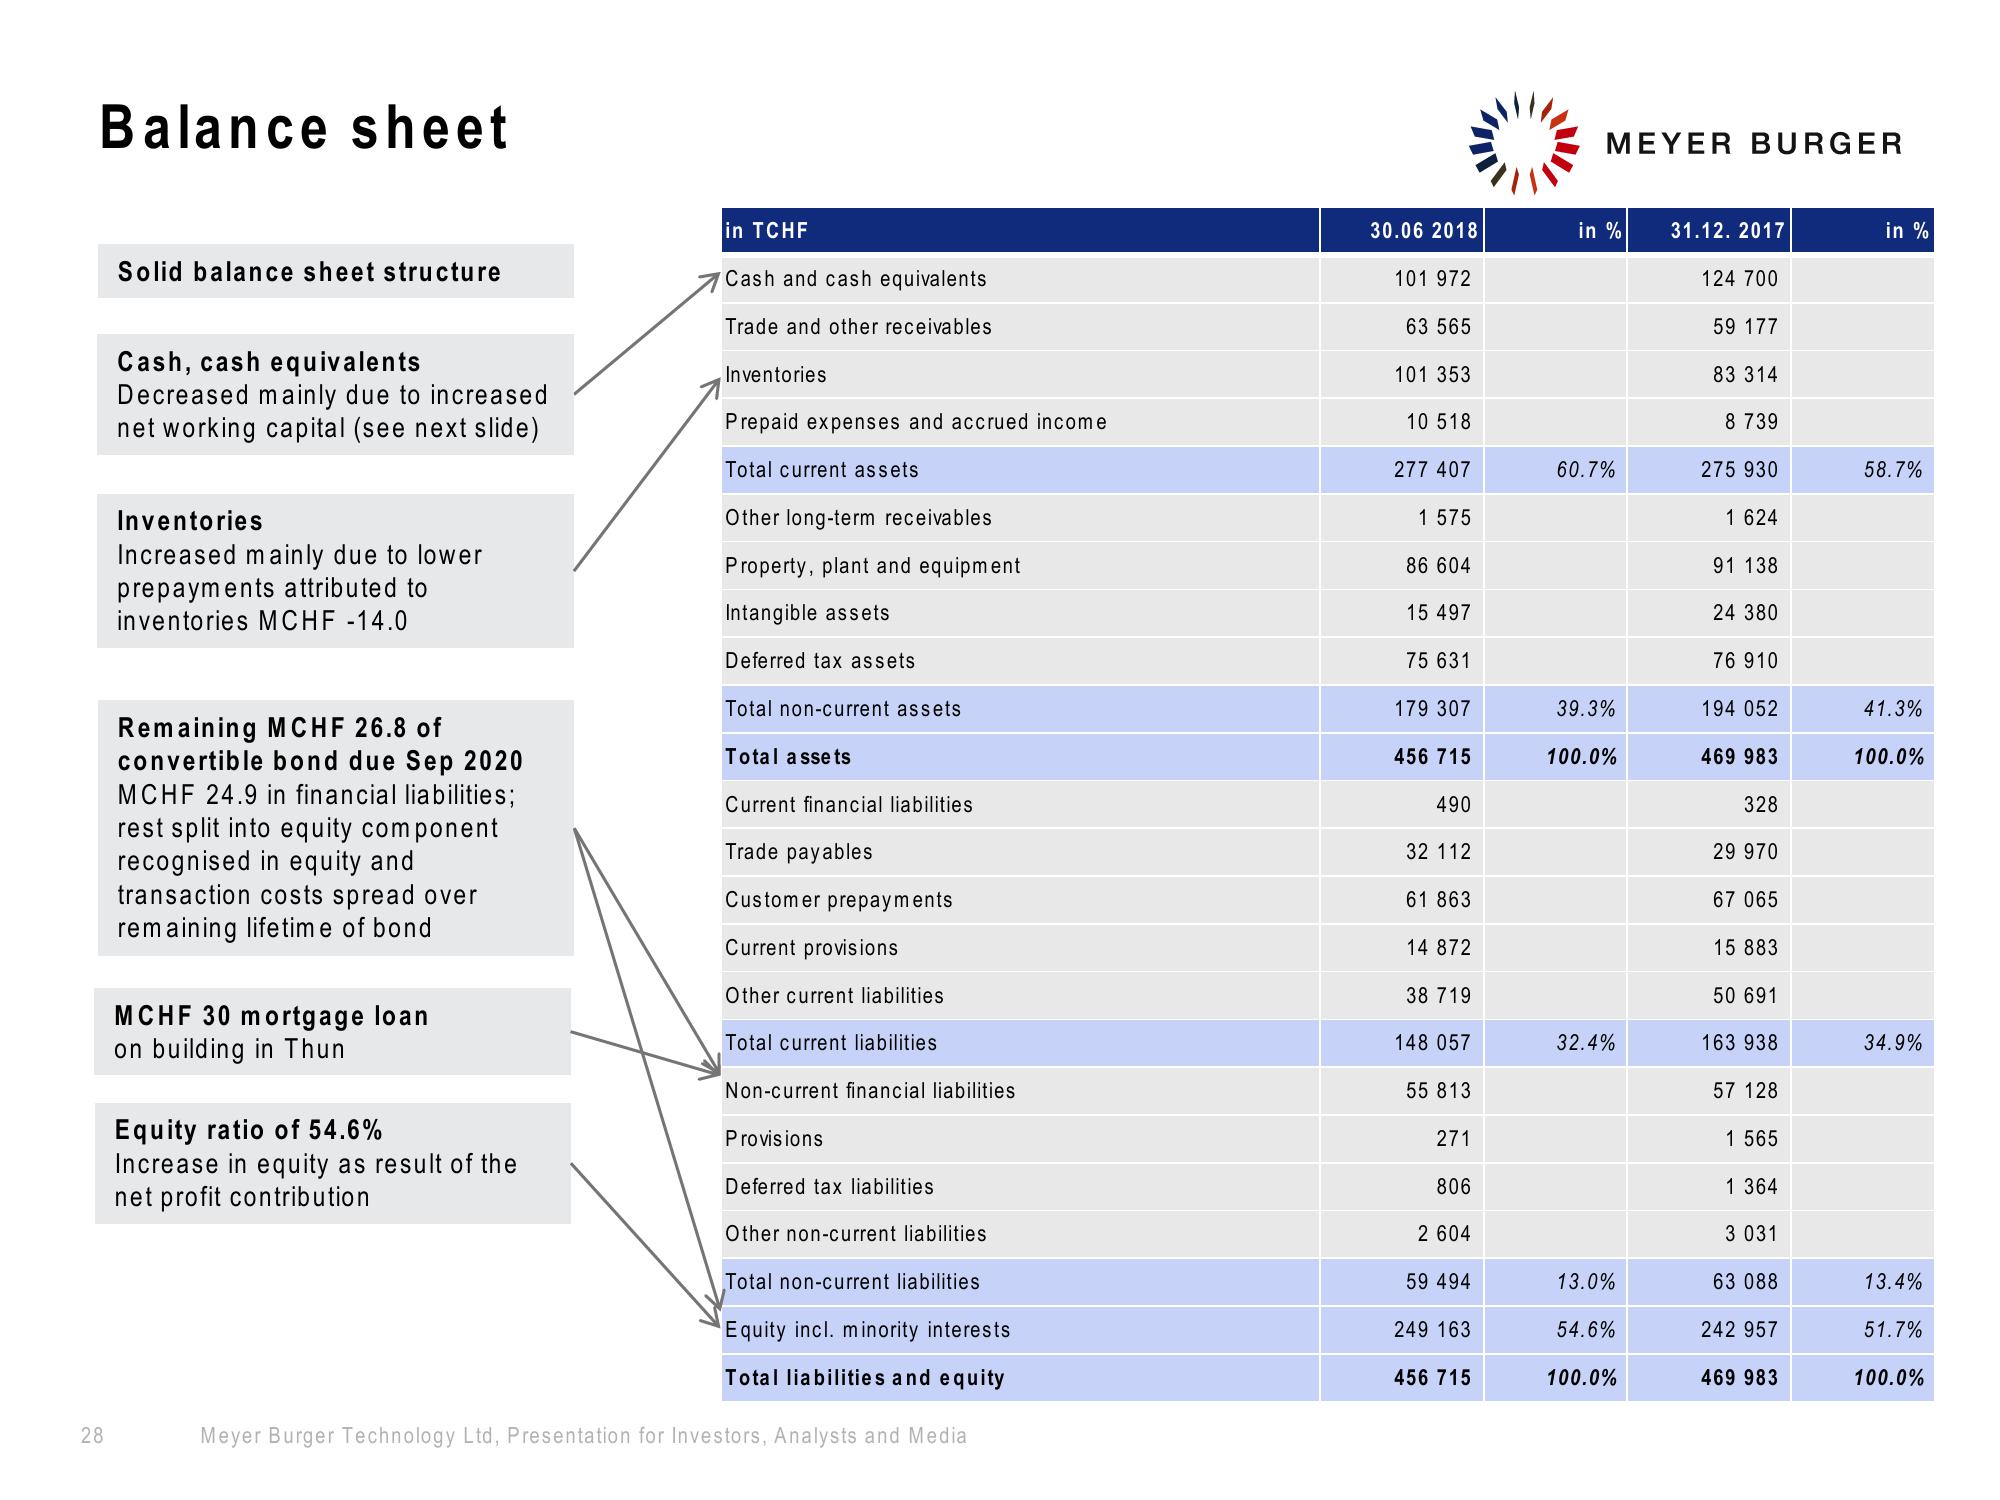
Solid balance sheet structure
in TCHF
Cash and cash equivalents
30.06 2018
in %
31.12. 2017
in %
101 972
124 700
Trade and other receivables
63 565
59 177
Cash, cash equivalents
Decreased mainly due to increased
net working capital (see next slide)
Inventories
101 353
83 314
Prepaid expenses and accrued income
10 518
8 739
Total current assets
277 407
60.7%
275 930
58.7%
Inventories
Increased mainly due to lower
prepayments attributed to
inventories MCHF -14.0
Other long-term receivables
1 575
1 624
Property, plant and equipment
86 604
91 138
Intangible assets
15 497
24 380
Deferred tax assets
75 631
76 910
Total non-current assets
179 307
39.3%
194 052
41.3%
Remaining MCHF 26.8 of
convertible bond due Sep 2020
MCHF 24.9 in financial liabilities;
rest split into equity component
recognised in equity and
transaction costs spread over
remaining lifetime of bond
MCHF 30 mortgage loan
on building in Thun
Equity ratio of 54.6%
Increase in equity as result of the
net profit contribution
Current provisions
Other current liabilities
Total assets
456 715
100.0%
469 983
100.0%
Current financial liabilities
490
328
Trade payables
32 112
29 970
Customer prepayments
61 863
67 065
14 872
15 883
38 719
50 691
Total current liabilities
148 057
32.4%
163 938
34.9%
Non-current financial liabilities
55 813
57 128
Provisions
271
1 565
Deferred tax liabilities
806
1 364
Other non-current liabilities
2 604
3 031
Total non-current liabilities
59 494
13.0%
63 088
13.4%
Equity incl. minority interests
249 163
54.6%
242 957
51.7%
Total liabilities and equity
456 715
100.0%
469 983
100.0%
28
Meyer Burger Technology Ltd, Presentation for Investors, Analysts and MediaView entire presentation