OpenText Investor Presentation Deck
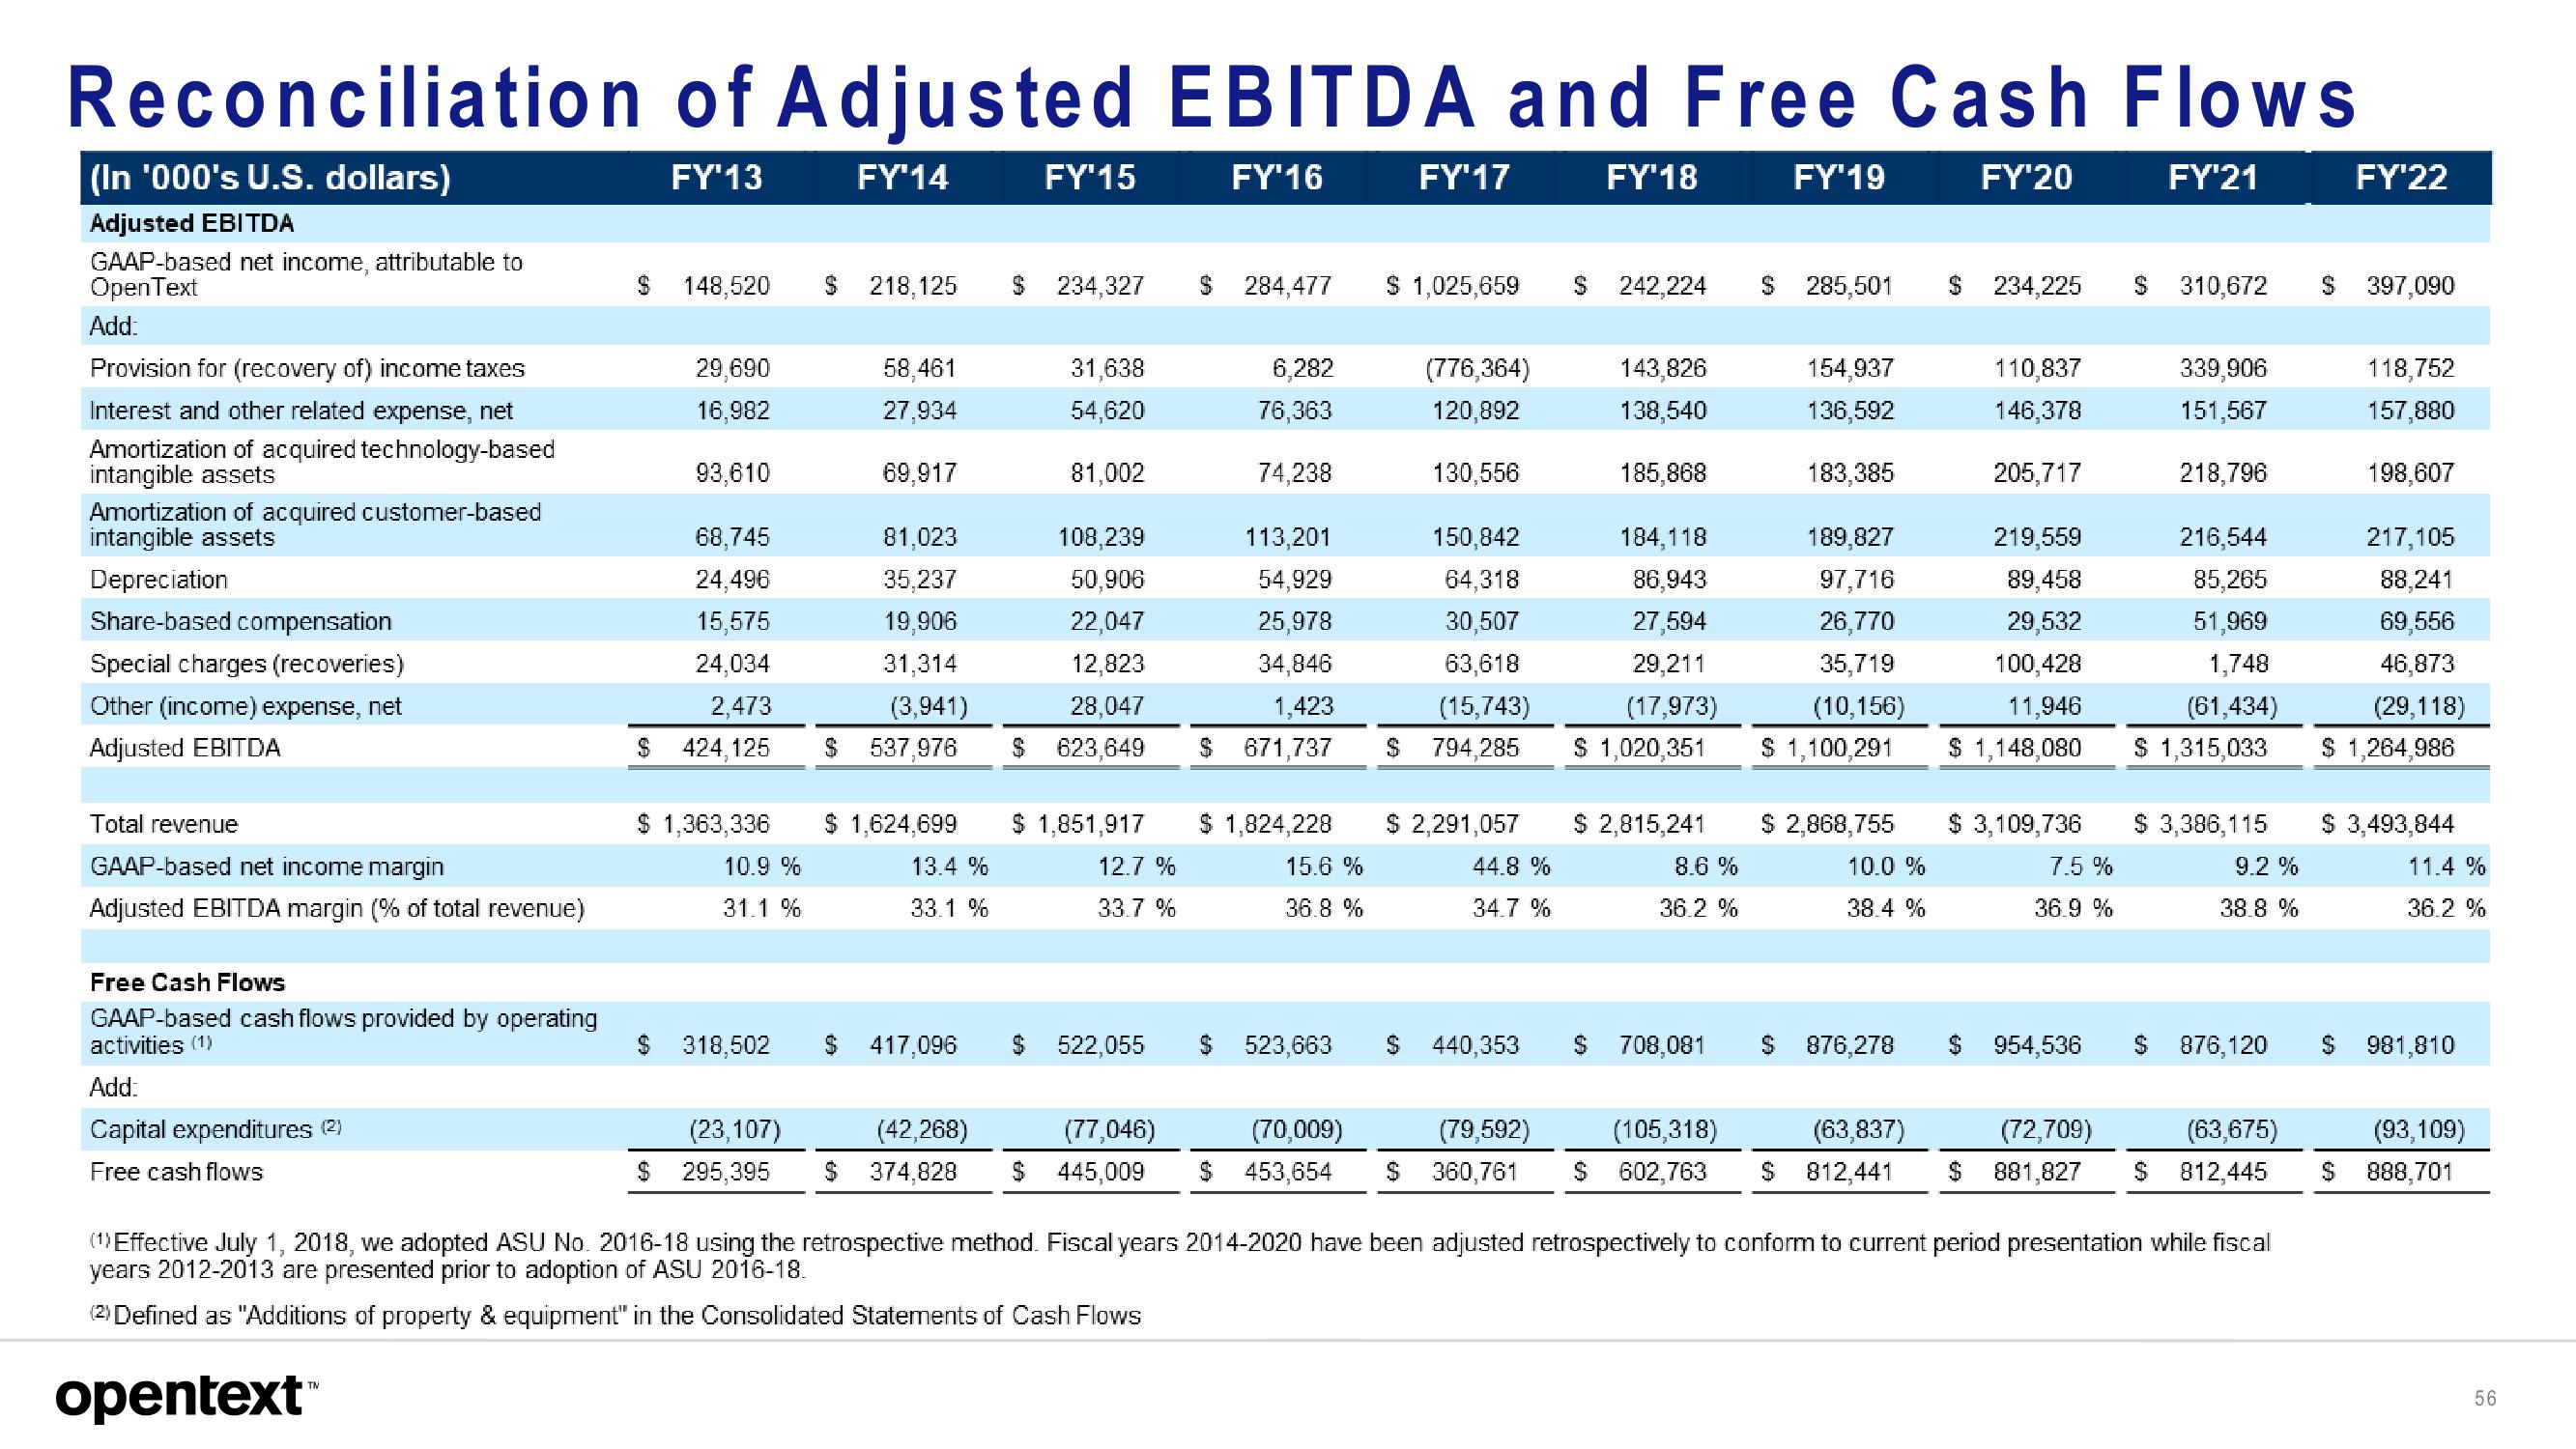
Reconciliation of Adjusted EBITDA and Free Cash Flows
FY'13
FY'14
FY'16
FY'20
FY'21
(In '000's U.S. dollars)
Adjusted EBITDA
GAAP-based net income, attributable to
OpenText
Add:
Provision for (recovery of) income taxes
Interest and other related expense, net
Amortization of acquired technology-based
intangible assets
Amortization of acquired customer-based
intangible assets
Depreciation
Share-based compensation
Special charges (recoveries)
Other (income) expense, net
Adjusted EBITDA
Total revenue
GAAP-based net income margin
Adjusted EBITDA margin (% of total revenue)
Free Cash Flows
GAAP-based cash flows provided by operating
activities (1)
Add:
Capital expenditures (2)
Free cash flows
$ 148,520
opentext™
$
29,690
16,982
93,610
68,745
24,496
15,575
24,034
2,473
424, 125
6 1,363,336
10.9 %
31.1 %
$ 318,502
(23,107)
$ 295,395
$ 218,125 $ 234,327
58,461
27,934
69,917
31,638
54,620
81,002
108,239
50,906
22,047
12,823
28,047
$ 537,976 $ 623,649
FY'15
81,023
35,237
19,906
31,314
(3,941)
1,624,699 $ 1,851,917
13.4 %
12.7 %
33.7%
33.1 %
$ 417,096
522,055
(42,268)
(77,046)
$ 374,828 $ 445,009
284,477
6,282
76,363
74,238
113,201
54,929
25,978
34,846
1,423
671,737
$ 1,824,228
15.6 %
36.8 %
FY'17
$ 1,025,659
(776,364)
120,892
130,556
150,842
64,318
30,507
63,618
(15,743)
$ 794,285
$ 2,291,057
44.8 %
34.7 %
523,663 $ 440,353
FY'18
$ 242,224 $ 285,501 $ 234,225 $ 310,672
143,826
138,540
185,868
184,118
86,943
27,594
29,211
(17,973)
$ 1,020,351
$ 2,815,241
8.6 %
36.2 %
FY'19
708,081
154,937
136,592
183,385
189,827
97,716
26,770
35,719
(10,156)
$ 1,100,291
$ 2,868,755
10.0 %
38.4 %
$ 876,278
110,837
146,378
205,717
219,559
89,458
29,532
100,428
11,946
$ 1,148,080
$ 3,109,736
$
7.5 %
36.9%
954,536
339,906
151,567
218,796
216,544
85,265
51,969
1,748
(61,434)
$ 1,315,033
$ 3,386,115
9.2 %
38.8%
$ 876,120
(70,009)
(79,592)
(105,318)
(63,837)
(72,709)
(63,675)
$ 453,654 $ 360,761 $ 602,763 $ 812,441 $ 881,827 $ 812,445
(1) Effective July 1, 2018, we adopted ASU No. 2016-18 using the retrospective method. Fiscal years 2014-2020 have been adjusted retrospectively to conform to current period presentation while fiscal
years 2012-2013 are presented prior to adoption of ASU 2016-18.
(2) Defined as "Additions of property & equipment" in the Consolidated Statements of Cash Flows
FY'22
$ 397,090
118,752
157,880
198,607
217,105
88,241
69,556
46,873
(29,118)
$ 1,264,986
$ 3,493,844
11.4 %
36.2 %
981,810
(93,109)
$ 888,701
56View entire presentation