TPG Results Presentation Deck
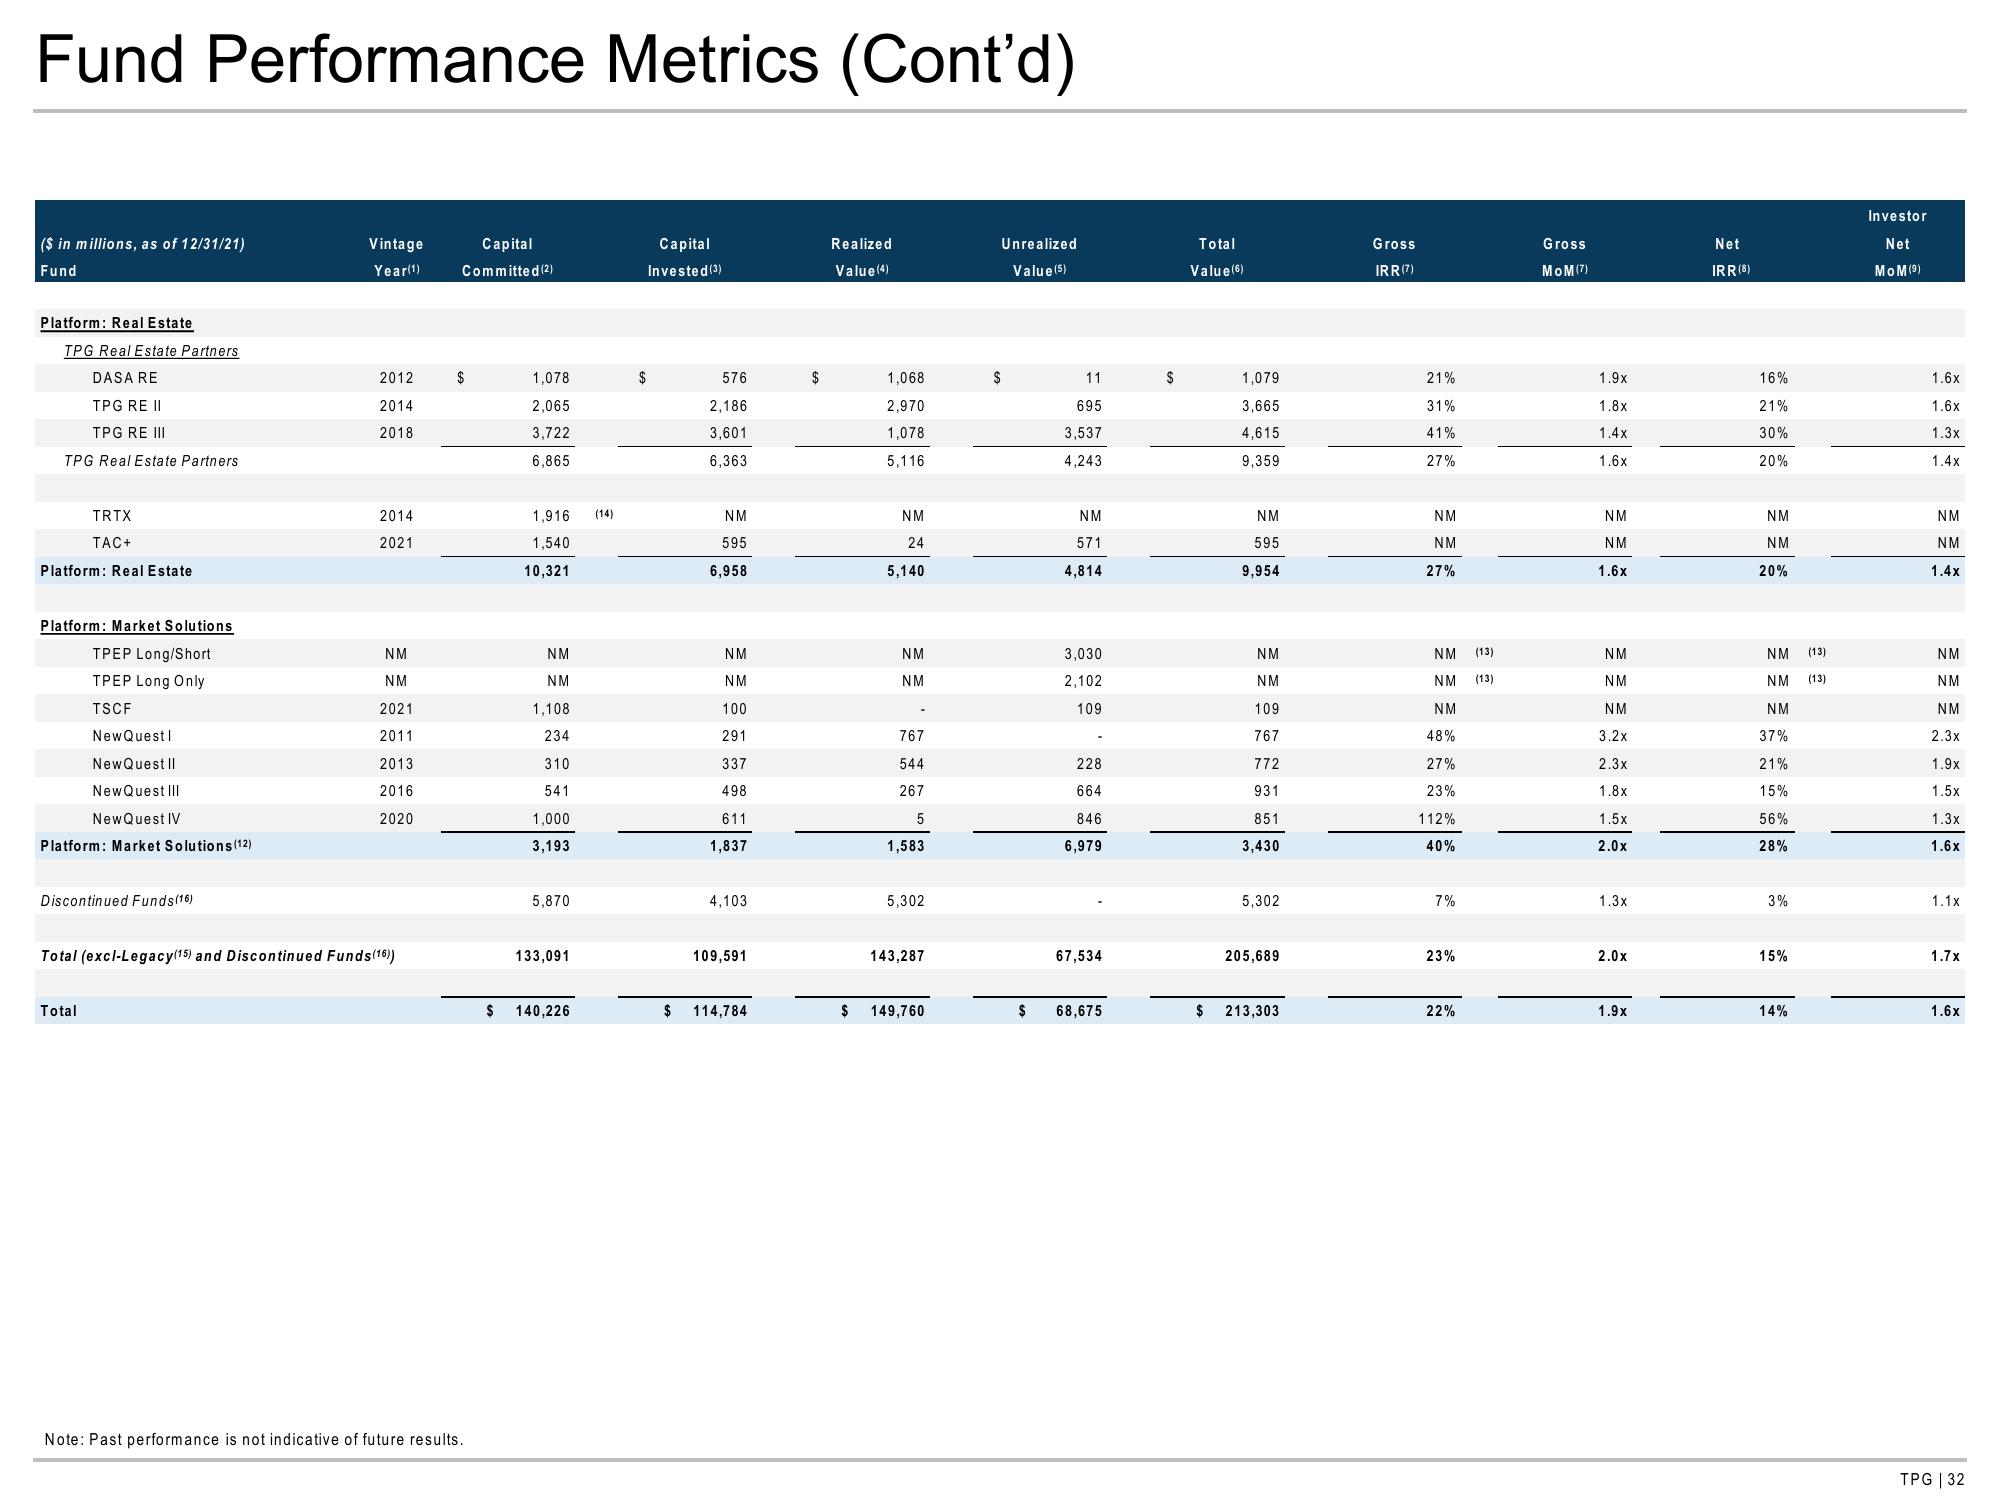
Fund Performance Metrics (Cont'd)
($ in millions, as of 12/31/21)
Fund
Platform: Real Estate
TPG Real Estate Partners
DASA RE
TPG RE II
TPG RE III
TPG Real Estate Partners
TRTX
TAC+
Platform: Real Estate
Platform: Market Solutions
TPEP Long/Short
TPEP Long Only
TSCF
NewQuestl
New Quest II
NewQuest III
NewQuest IV
Platform: Market Solutions (12)
Discontinued Funds (16)
Total
Vintage
Year(1)
2012
2014
2018
2014
2021
NM
NM
2021
2011
2013
2016
2020
Total (excl-Legacy (15) and Discontinued Funds (16))
Capital
Committed (2)
$
Note: Past performance is not indicative of future results.
1,078
2,065
3,722
6,865
1,916
1,540
10,321
NM
NM
1,108
234
310
541
1,000
3,193
5,870
133,091
$ 140,226
(14)
Capital
Invested (3)
$
576
2,186
3,601
6,363
NM
595
6,958
NM
NM
100
291
337
498
611
1,837
4,103
109,591
$ 114,784
$
Realized
Value (4)
$
1,068
2,970
1,078
5,116
NM
24
5,140
NM
NM
767
544
267
5
1,583
5,302
143,287
149,760
$
Unrealized
Value (5)
11
695
3,537
4,243
NM
571
4,814
3,030
2,102
109
228
664
846
6,979
67,534
$ 68,675
$
Total
Value (6)
1,079
3,665
4,615
9,359
NM
595
9,954
NM
NM
109
767
772
931
851
3,430
5,302
205,689
$ 213,303
Gross
IRR (7)
21%
31%
41%
27%
NM
NM
27%
NM (13)
NM (13)
NM
48%
27%
23%
112%
40%
7%
23%
22%
Gross
MOM (7)
1.9x
1.8x
1.4x
1.6x
NM
NM
1.6x
NM
NM
NM
3.2x
2.3x
1.8x
1.5x
2.0x
1.3x
2.0x
1.9x
Net
IRR (8)
16%
21%
30%
20%
NM
NM
20%
NM (13)
NM
(13)
NM
37%
21%
15%
56%
28%
3%
15%
14%
Investor
Net
MOM (⁹)
1.6x
1.6x
1.3x
1.4x
NM
NM
1.4x
NM
NM
NM
2.3x
1.9x
1.5x
1.3x
1.6x
1.1x
1.7x
1.6x
TPG | 32View entire presentation