Flutter Investor Day Presentation Deck
Australia
Pro forma £m
Average monthly players ('000s)
Sportsbook stakes
Sportsbook net revenue margin
Revenue
Cost of sales
Cost of sales as a % of net revenue
Gross profit
Sales & marketing costs
Contribution
Other operating costs
Adjusted EBITDA
Adjusted EBITDA margin
Depreciation and amortisation
Adjusted operating profit
Flutter
H1 2021
906
5,000
11.7%
585
(275)
47.0%
310
(59)
252
(51)
201
34.3%
(13)
188
H1 2020
596
3,723
11.7%
435
(200)
45.9%
235
(59)
176
(55)
121
27.9%
(14)
107
YOY
+52%
+34%
+35%
+38%
+110bps
+32%
-1%
+43%
-7%
+66%
+640bps
-9%
+76%
YOY CC
+27%
+27%
+30%
+100bps
+25%
-6%
+35%
-11%
+56%
+630bps
-15%
+66%
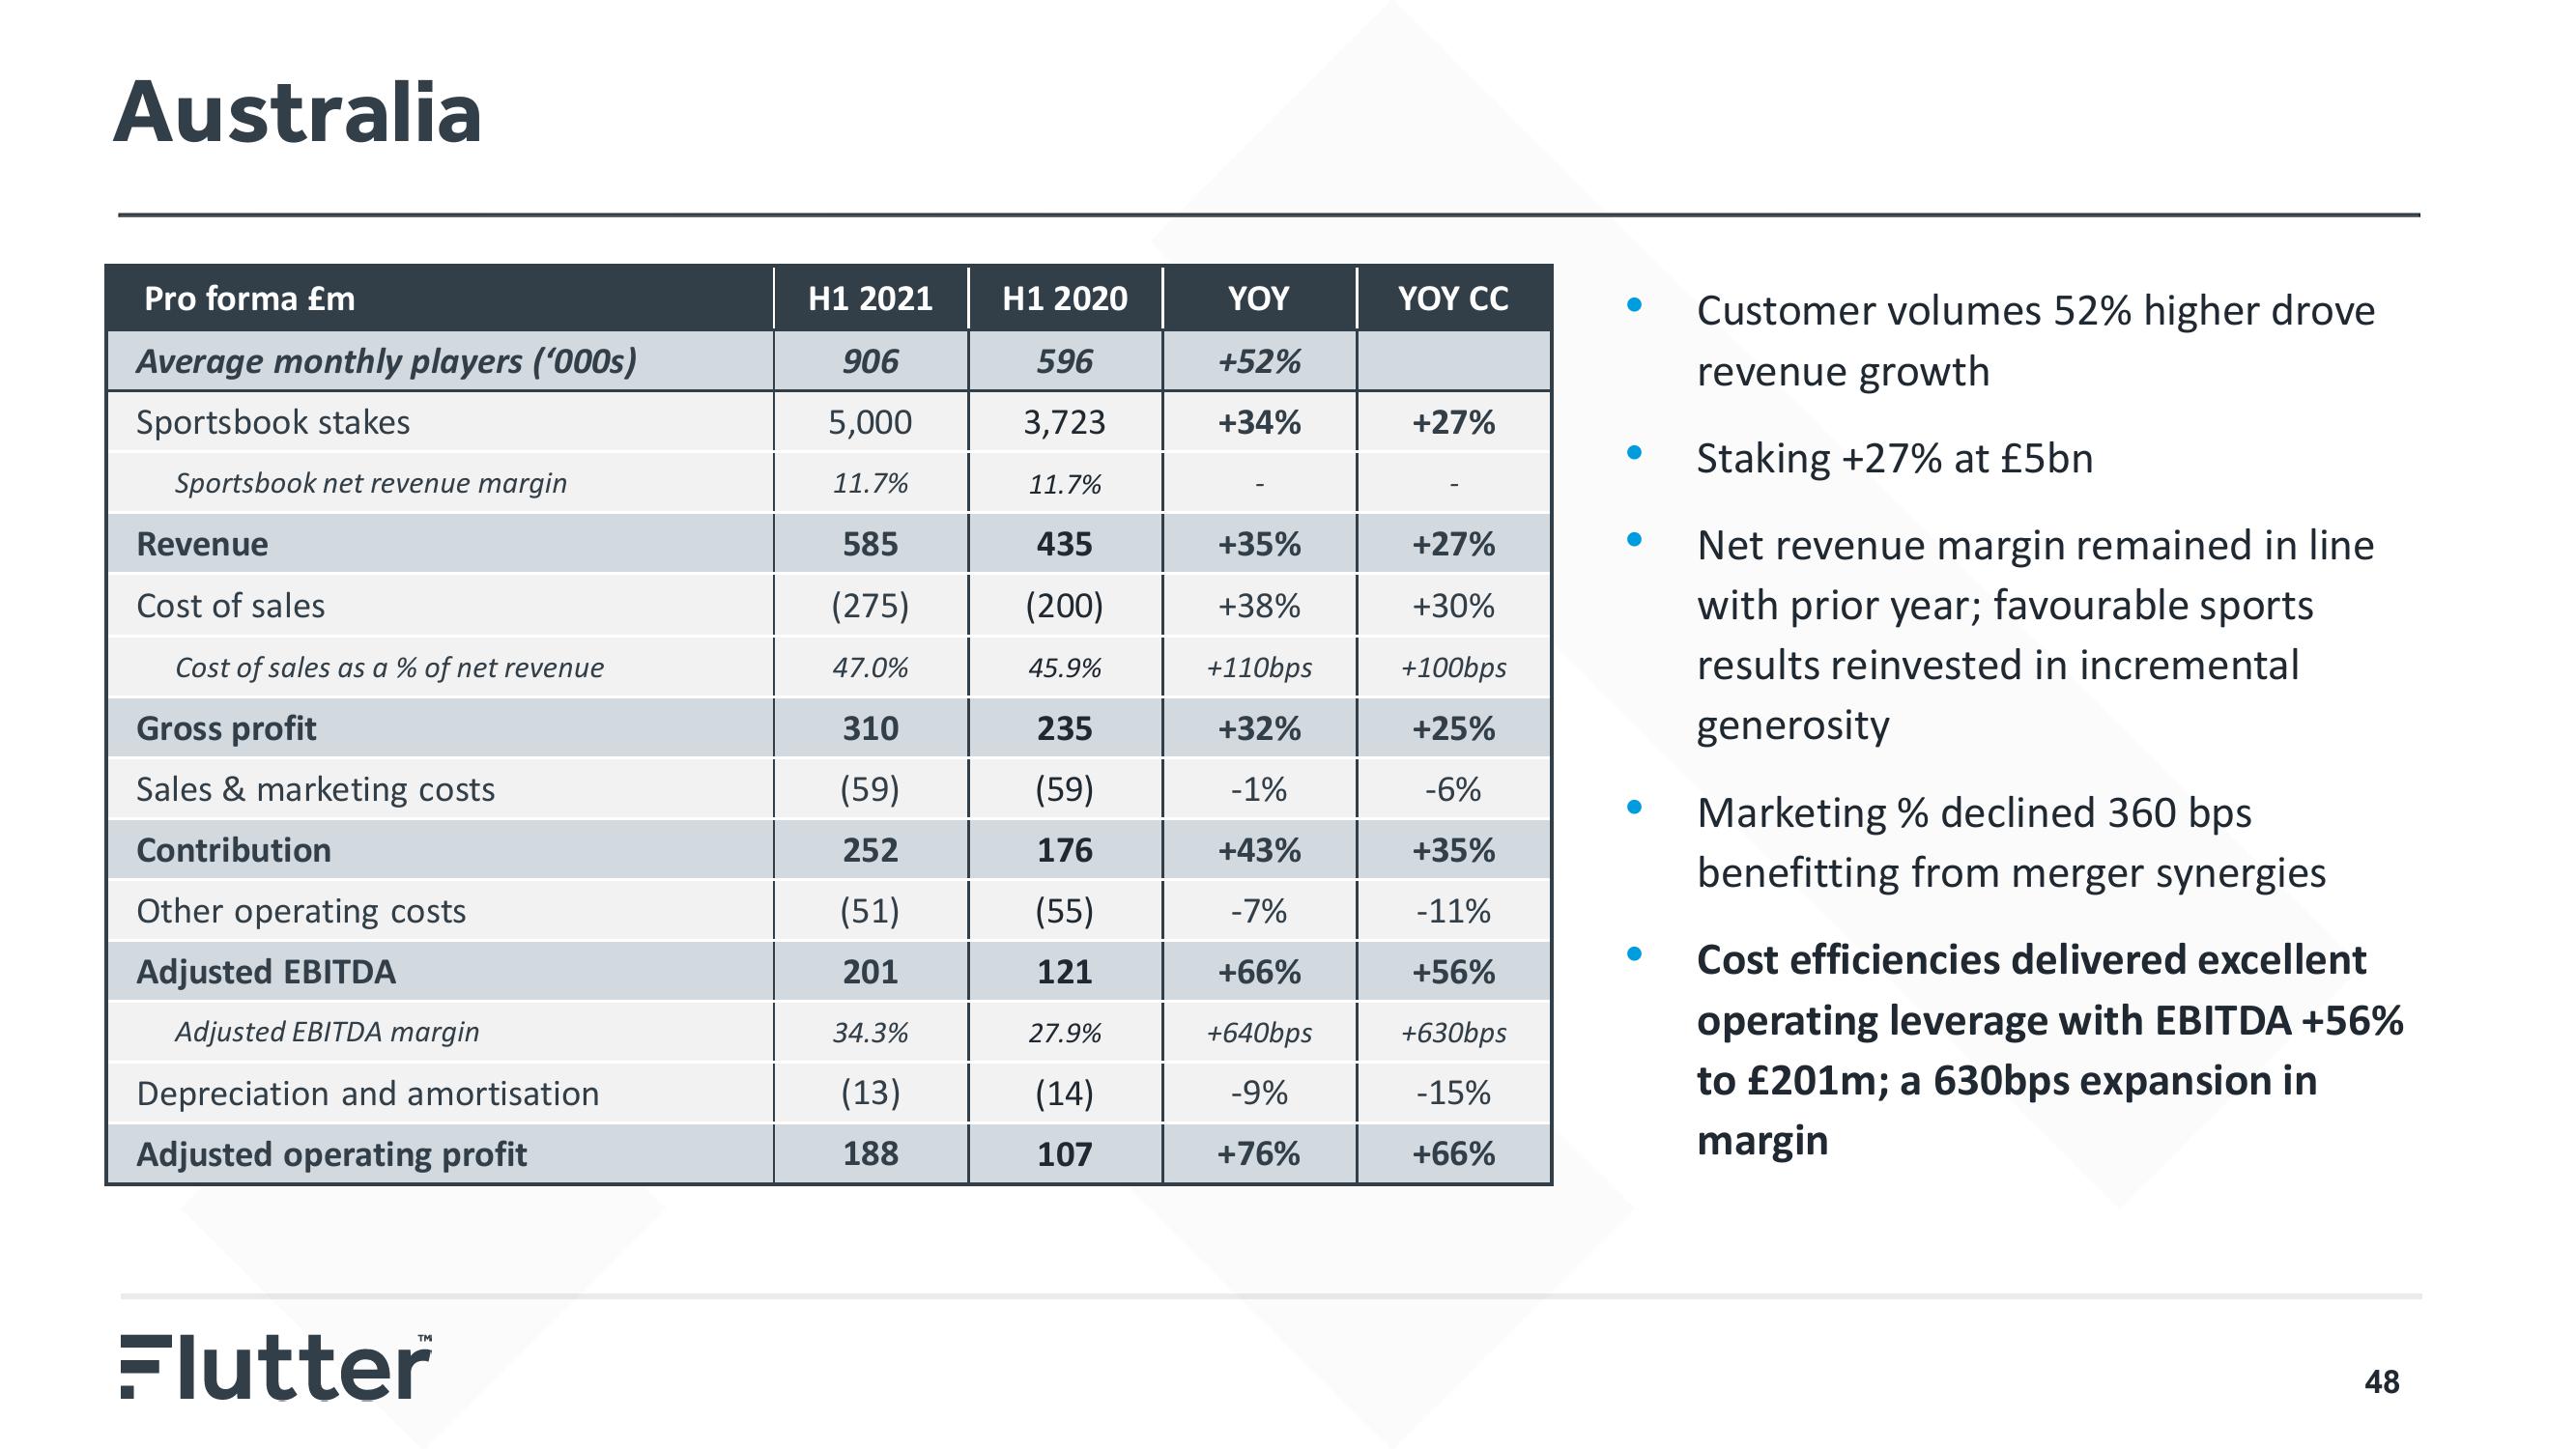
Customer volumes 52% higher drove
revenue growth
Staking +27% at £5bn
Net revenue margin remained in line.
with prior year; favourable sports
results reinvested in incremental
generosity
Marketing % declined 360 bps
benefitting from merger synergies
Cost efficiencies delivered excellent
operating leverage with EBITDA +56%
to £201m; a 630bps expansion in
margin
48View entire presentation