Telia Company Results Presentation Deck
TV & MEDIA
1,633
Service revenues
Reported currency, in millions, like for like growth
Q3 20
●
10
2,340
+15.4%
1,904
2,271
1,878
Q4 20 Q1 21 Q2 21 Q3 21
TV Advertising Other
Adj EBITDA
Reported currency, in millions, like for like growth
249
200
Q3 20 Q4 20
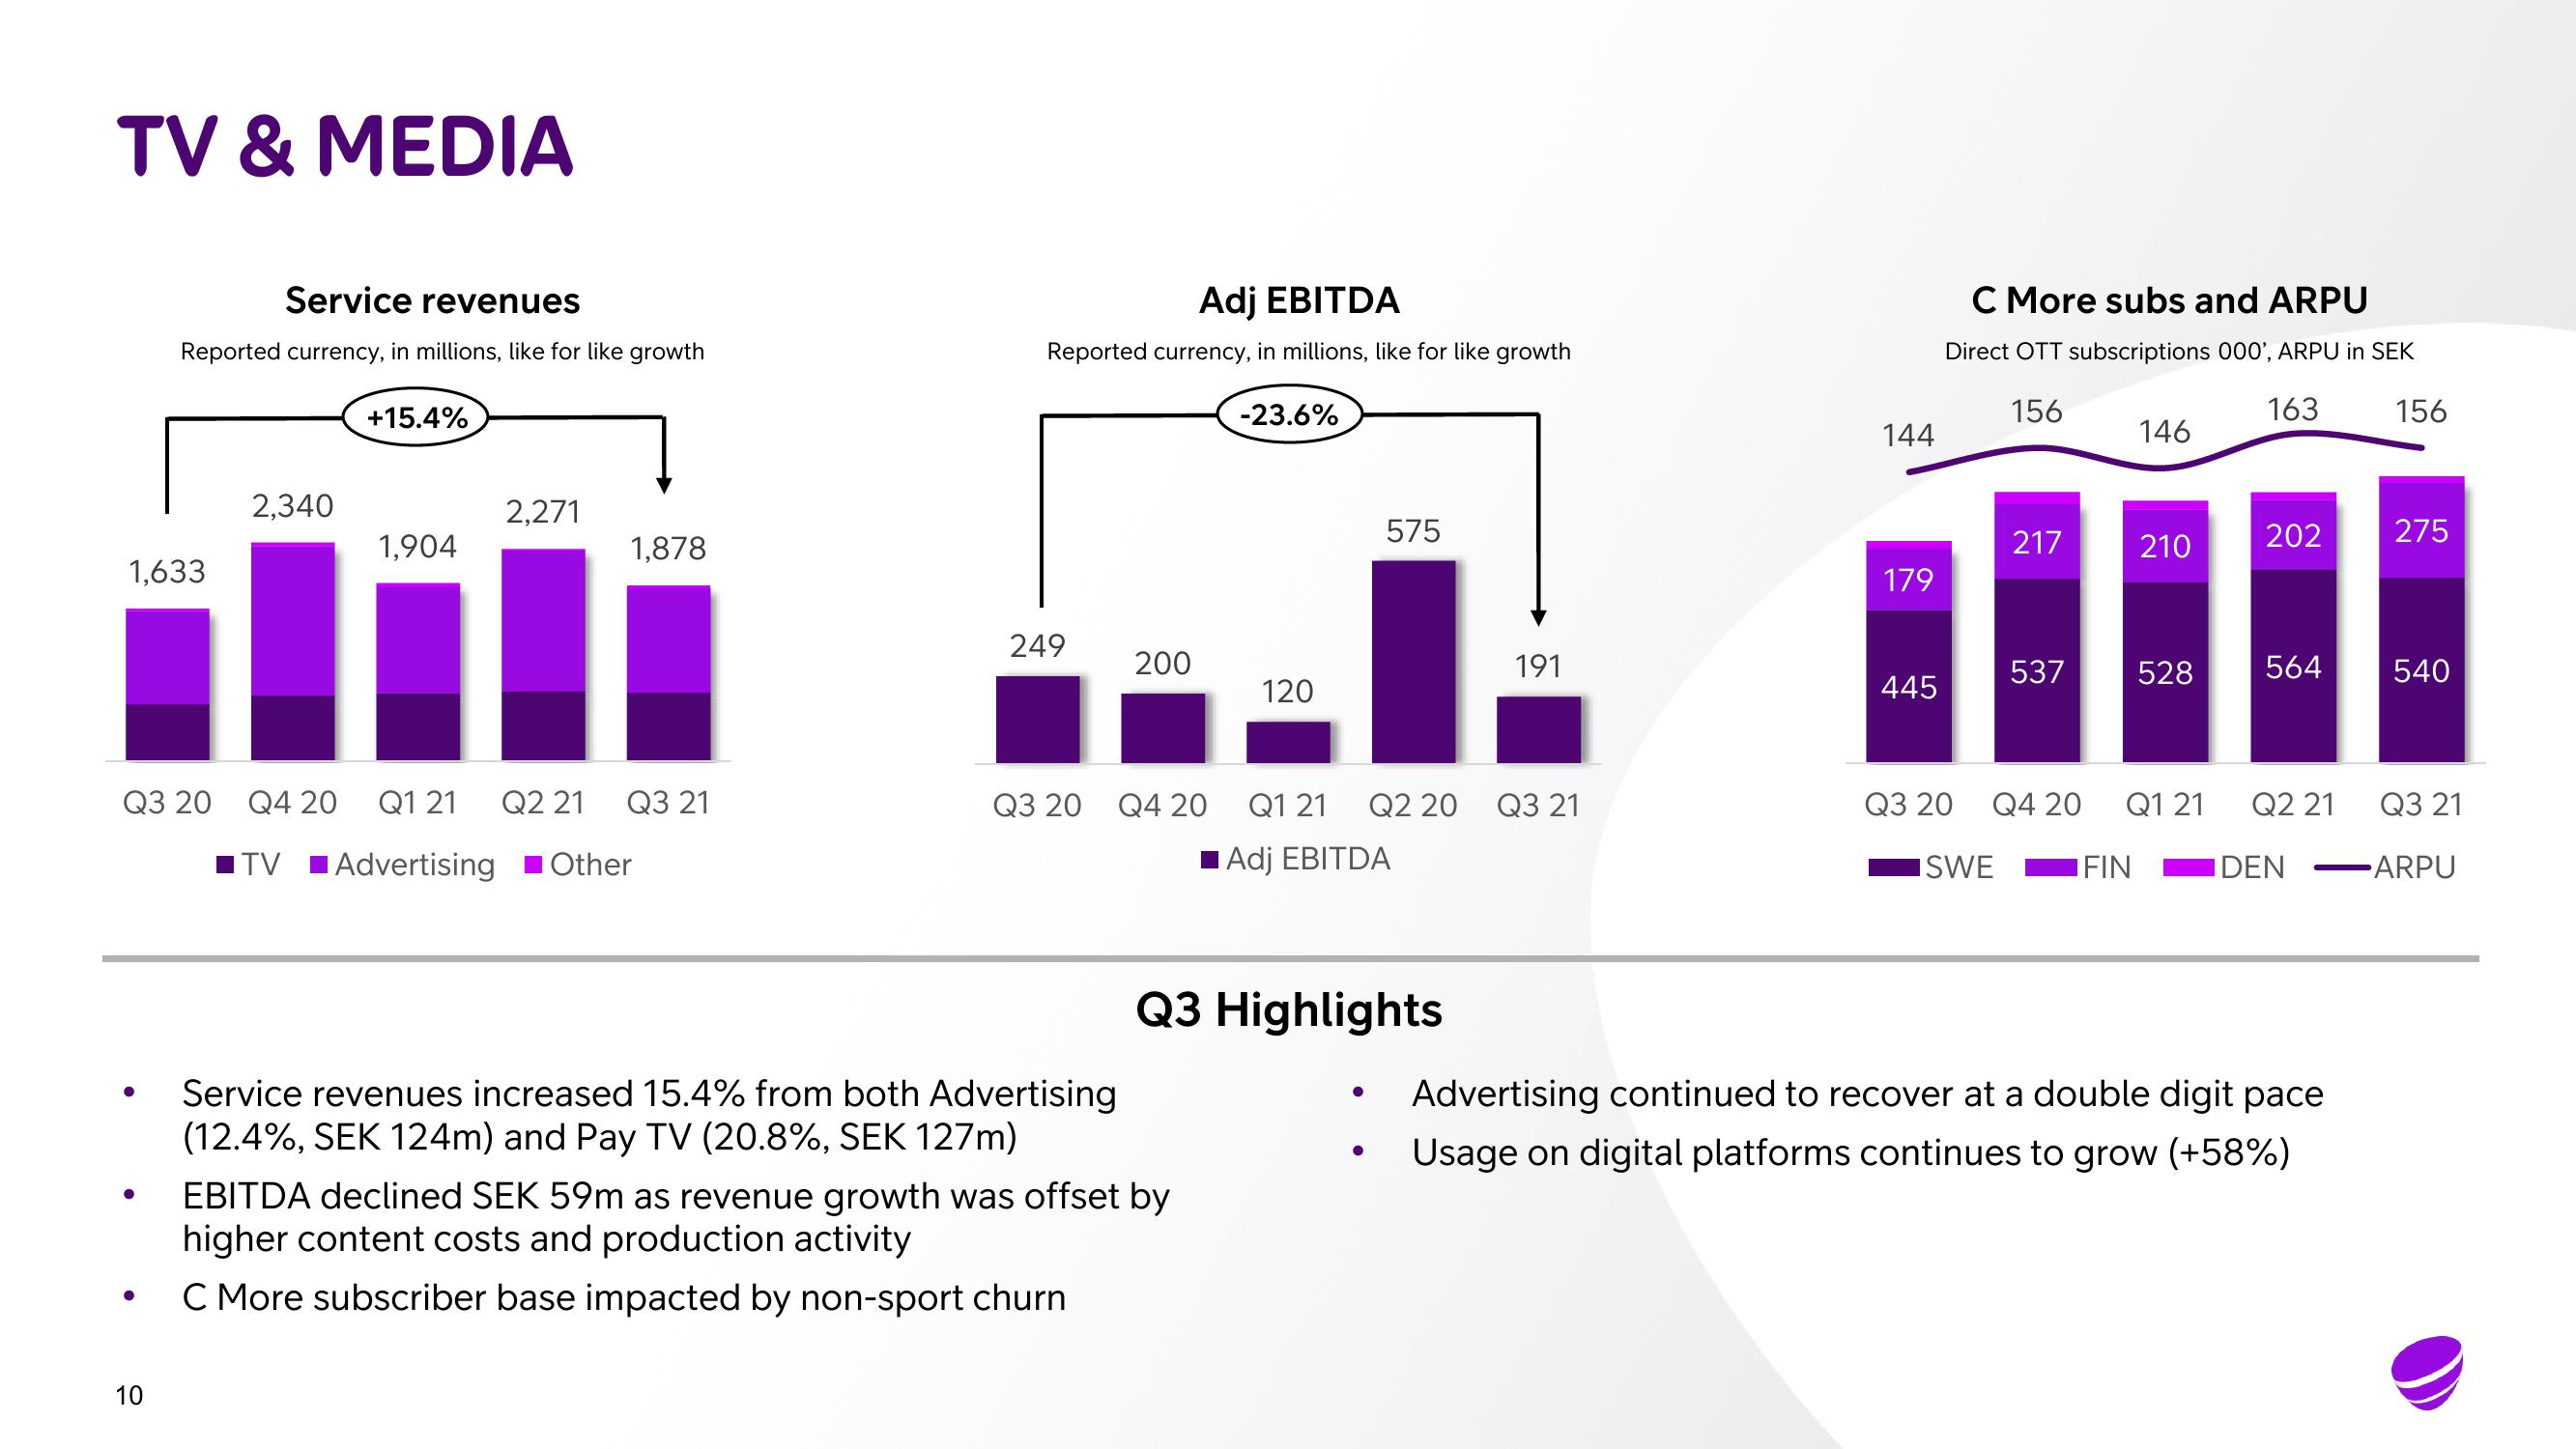
Service revenues increased 15.4% from both Advertising
(12.4%, SEK 124m) and Pay TV (20.8%, SEK 127m)
-23.6%
EBITDA declined SEK 59m as revenue growth was offset by
higher content costs and production activity
C More subscriber base impacted by non-sport churn
120
575
Q1 21 Q2 20
■Adj EBITDA
Q3 Highlights
●
191
Q3 21
144
179
445
C More subs and ARPU
Direct OTT subscriptions 000', ARPU in SEK
156
163
217
537
146
FIN
210
528
202
564
Q3 20 Q4 20 Q1 21 Q2 21
ISWE
IDEN
Advertising continued to recover at a double digit pace
Usage on digital platforms continues to grow (+58%)
156
275
540
Q3 21
-ARPUView entire presentation