Pershing Square Activist Presentation Deck
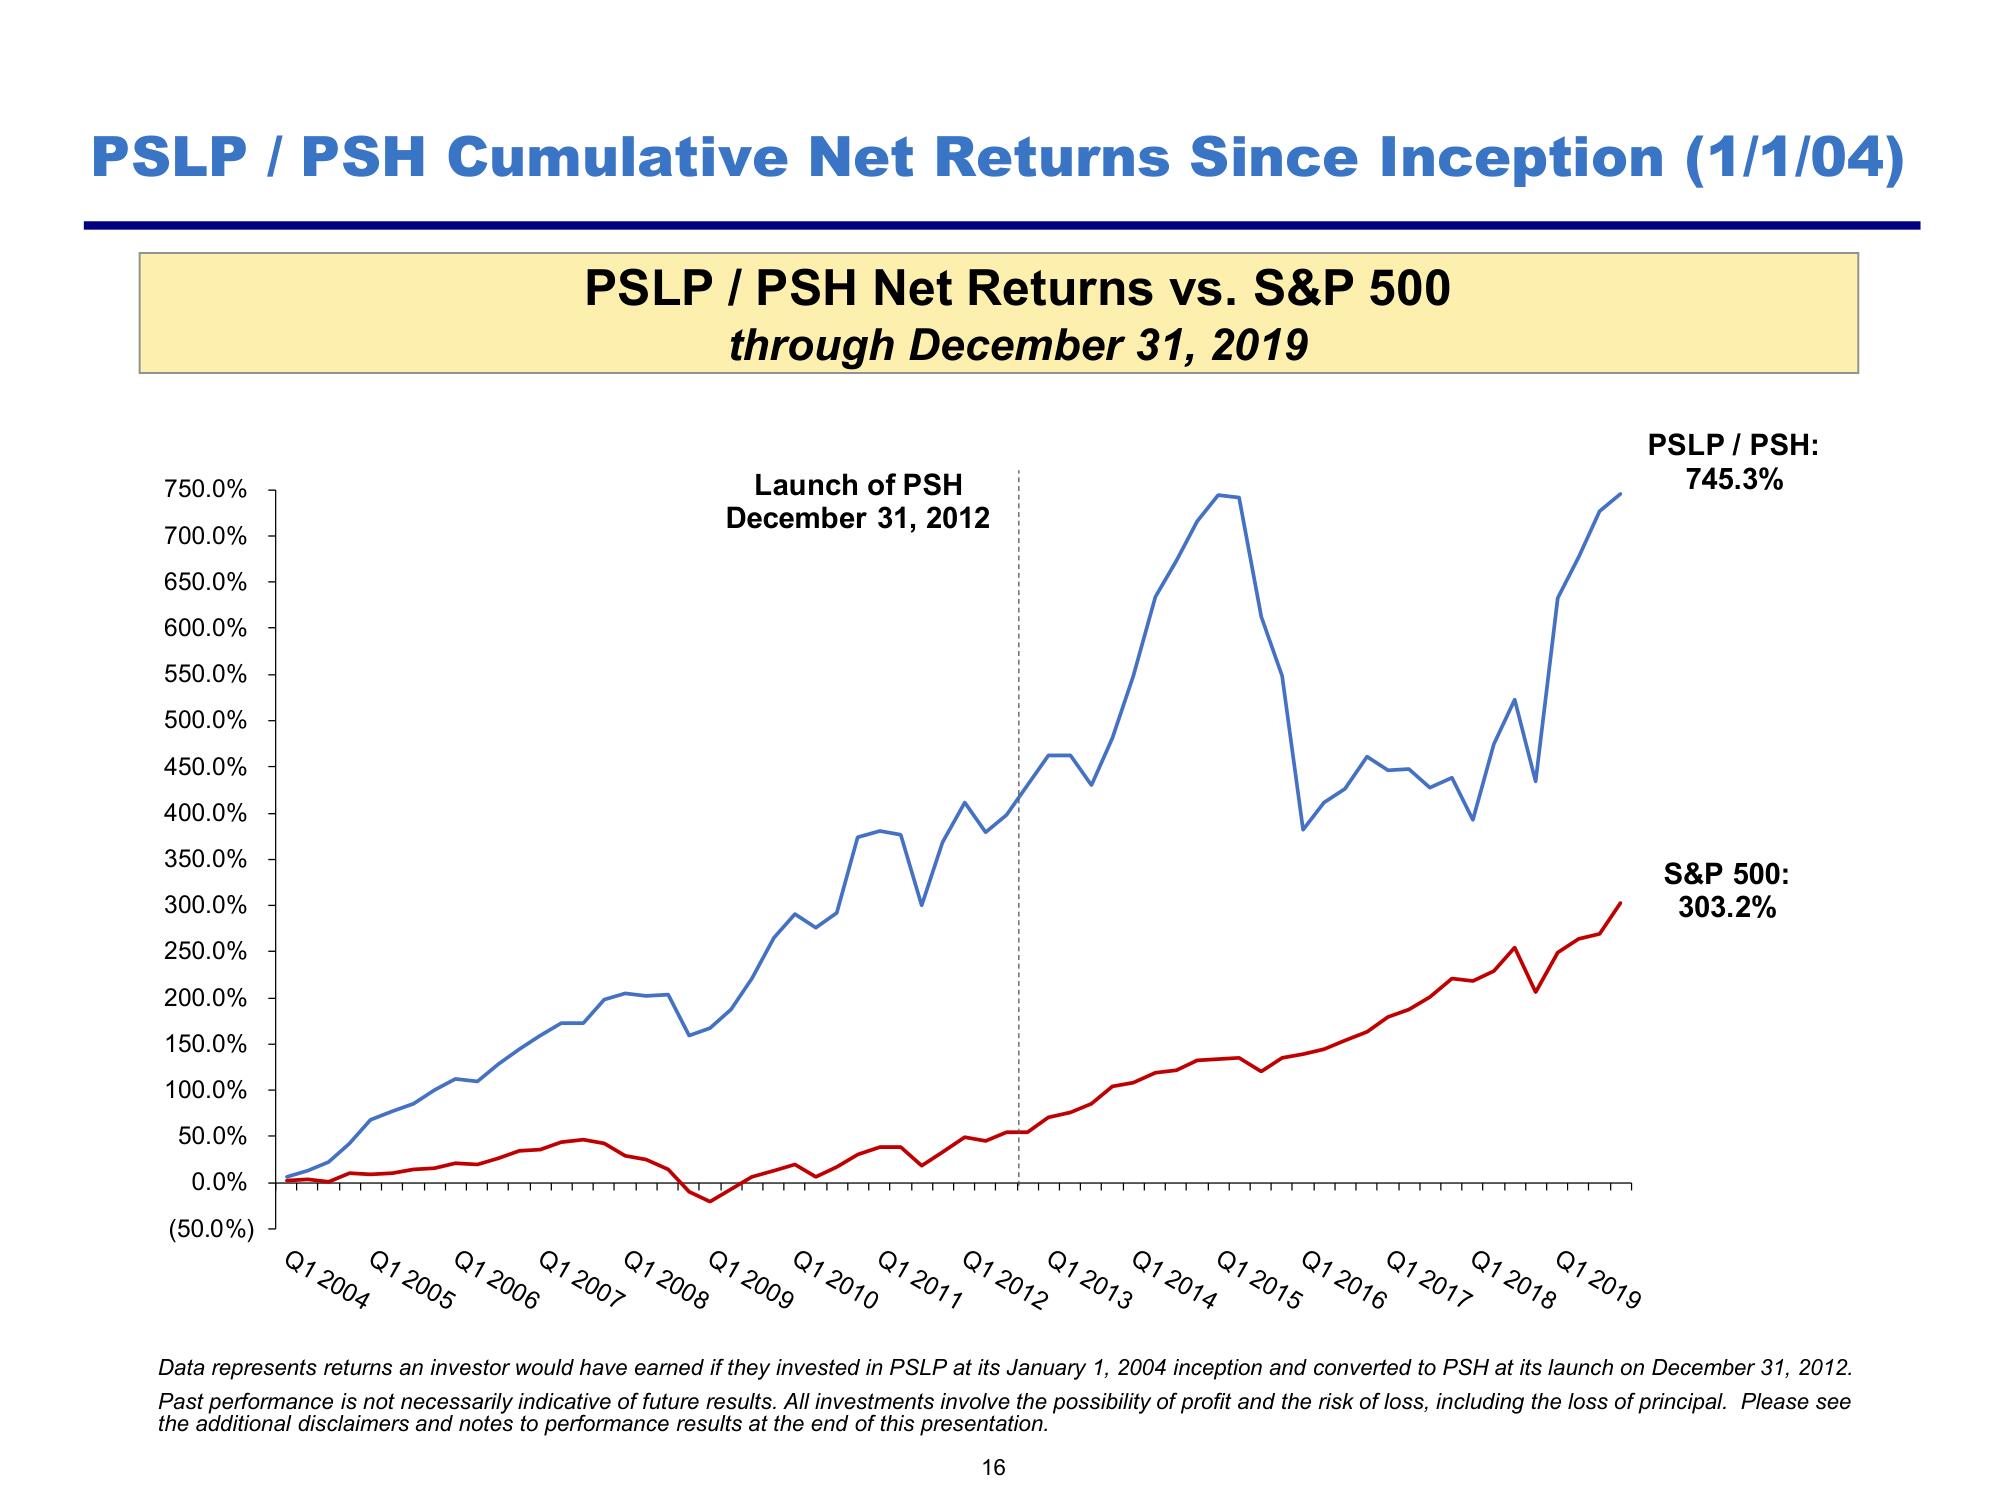
PSLP / PSH Cumulative Net Returns Since Inception (1/1/04)
PSLP / PSH Net Returns vs. S&P 500
through December 31, 2019
750.0%
700.0%
650.0%
600.0%
550.0%
500.0%
450.0%
400.0%
350.0%
300.0%
250.0%
200.0%
150.0%
100.0%
50.0%
0.0%
(50.0%)
Q1 2004
Q1 2005
Q1 2006
Q1
Q1
2007
Launch of PSH
December 31, 2012
2008
Q1 2009
Q1 2010
Q1 2012
Q1 2011
Q1 2013
Q1 2014
Q1 2015
Q1 2016
Q1 2017
PSLP / PSH:
745.3%
Q1 2018
Q1 2019
S&P 500:
303.2%
Data represents returns an investor would have earned if they invested in PSLP at its January 1, 2004 inception and converted to PSH at its launch on December 31, 2012.
Past performance is not necessarily indicative of future results. All investments involve the possibility of profit and the risk of loss, including the loss of principal. Please see
the additional disclaimers and notes to performance results at the end of this presentation.
16View entire presentation