LegalZoom.com Results Presentation Deck
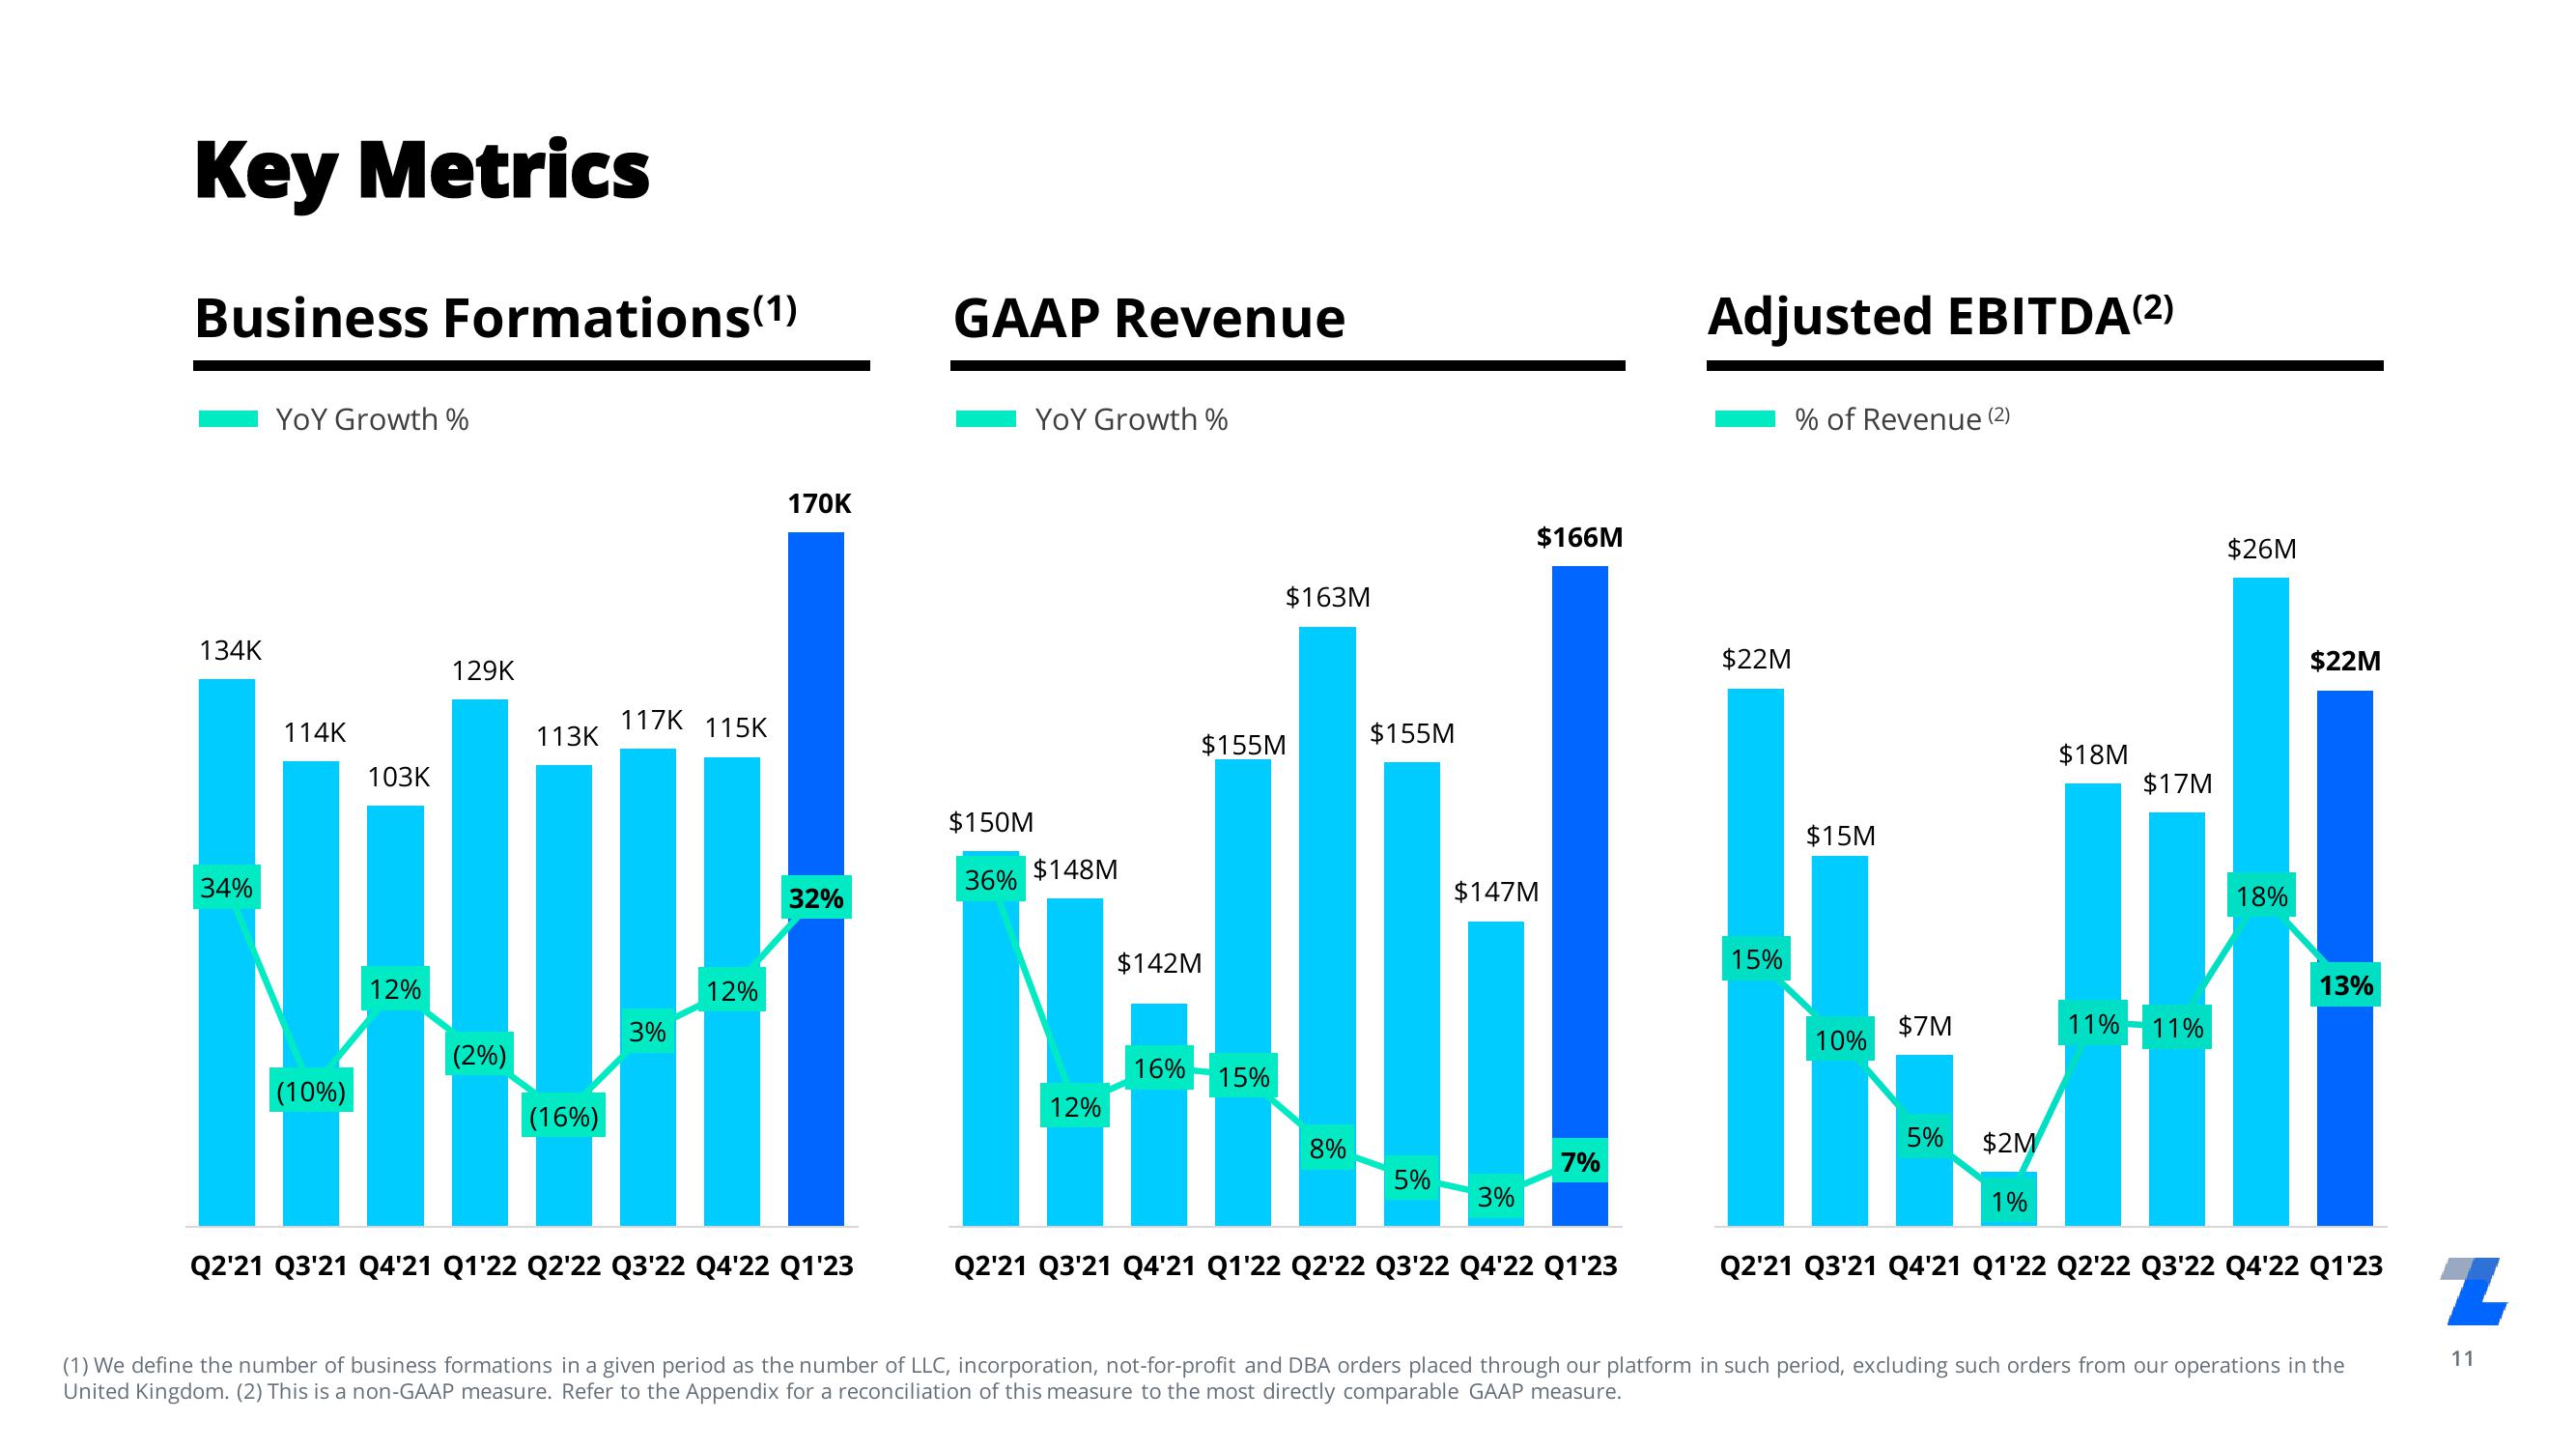
Key Metrics
Business Formations (1)
134K
34%
YOY Growth %
114K
(10%)
103K
129K
12%
(2%)
11
113K
(16%)
117K
3%
115K
12%
170K
32%
Q2'21 Q3'21 Q4'21 Q1'22 Q2'22 Q3'22 Q4'22 Q1'23
GAAP Revenue
YOY Growth %
$150M
36% $148M
12%
$142M
$155M
16% 15%
$163M
8%
$155M
5%
$147M
3%
$166M
7%
Q2'21 Q3'21 Q4'21 Q1'22 Q2'22 Q3'22 Q4'22 Q1'23
Adjusted EBITDA (²)
$22M
15%
% of Revenue (2)
$15M
10%
$7M
5%
$18M
$17M
11% 11%
$26M
18%
$22M
13%
$2M
1%
Q2'21 Q3'21 Q4'21 Q1'22 Q2'22 Q3'22 Q4'22 Q1'23
(1) We define the number of business formations in a given period as the number of LLC, incorporation, not-for-profit and DBA orders placed through our platform in such period, excluding such orders from our operations in the
United Kingdom. (2) This is a non-GAAP measure. Refer to the Appendix for a reconciliation of this measure to the most directly comparable GAAP measure.
Z
11View entire presentation