Palantir Results Presentation Deck
Appendix
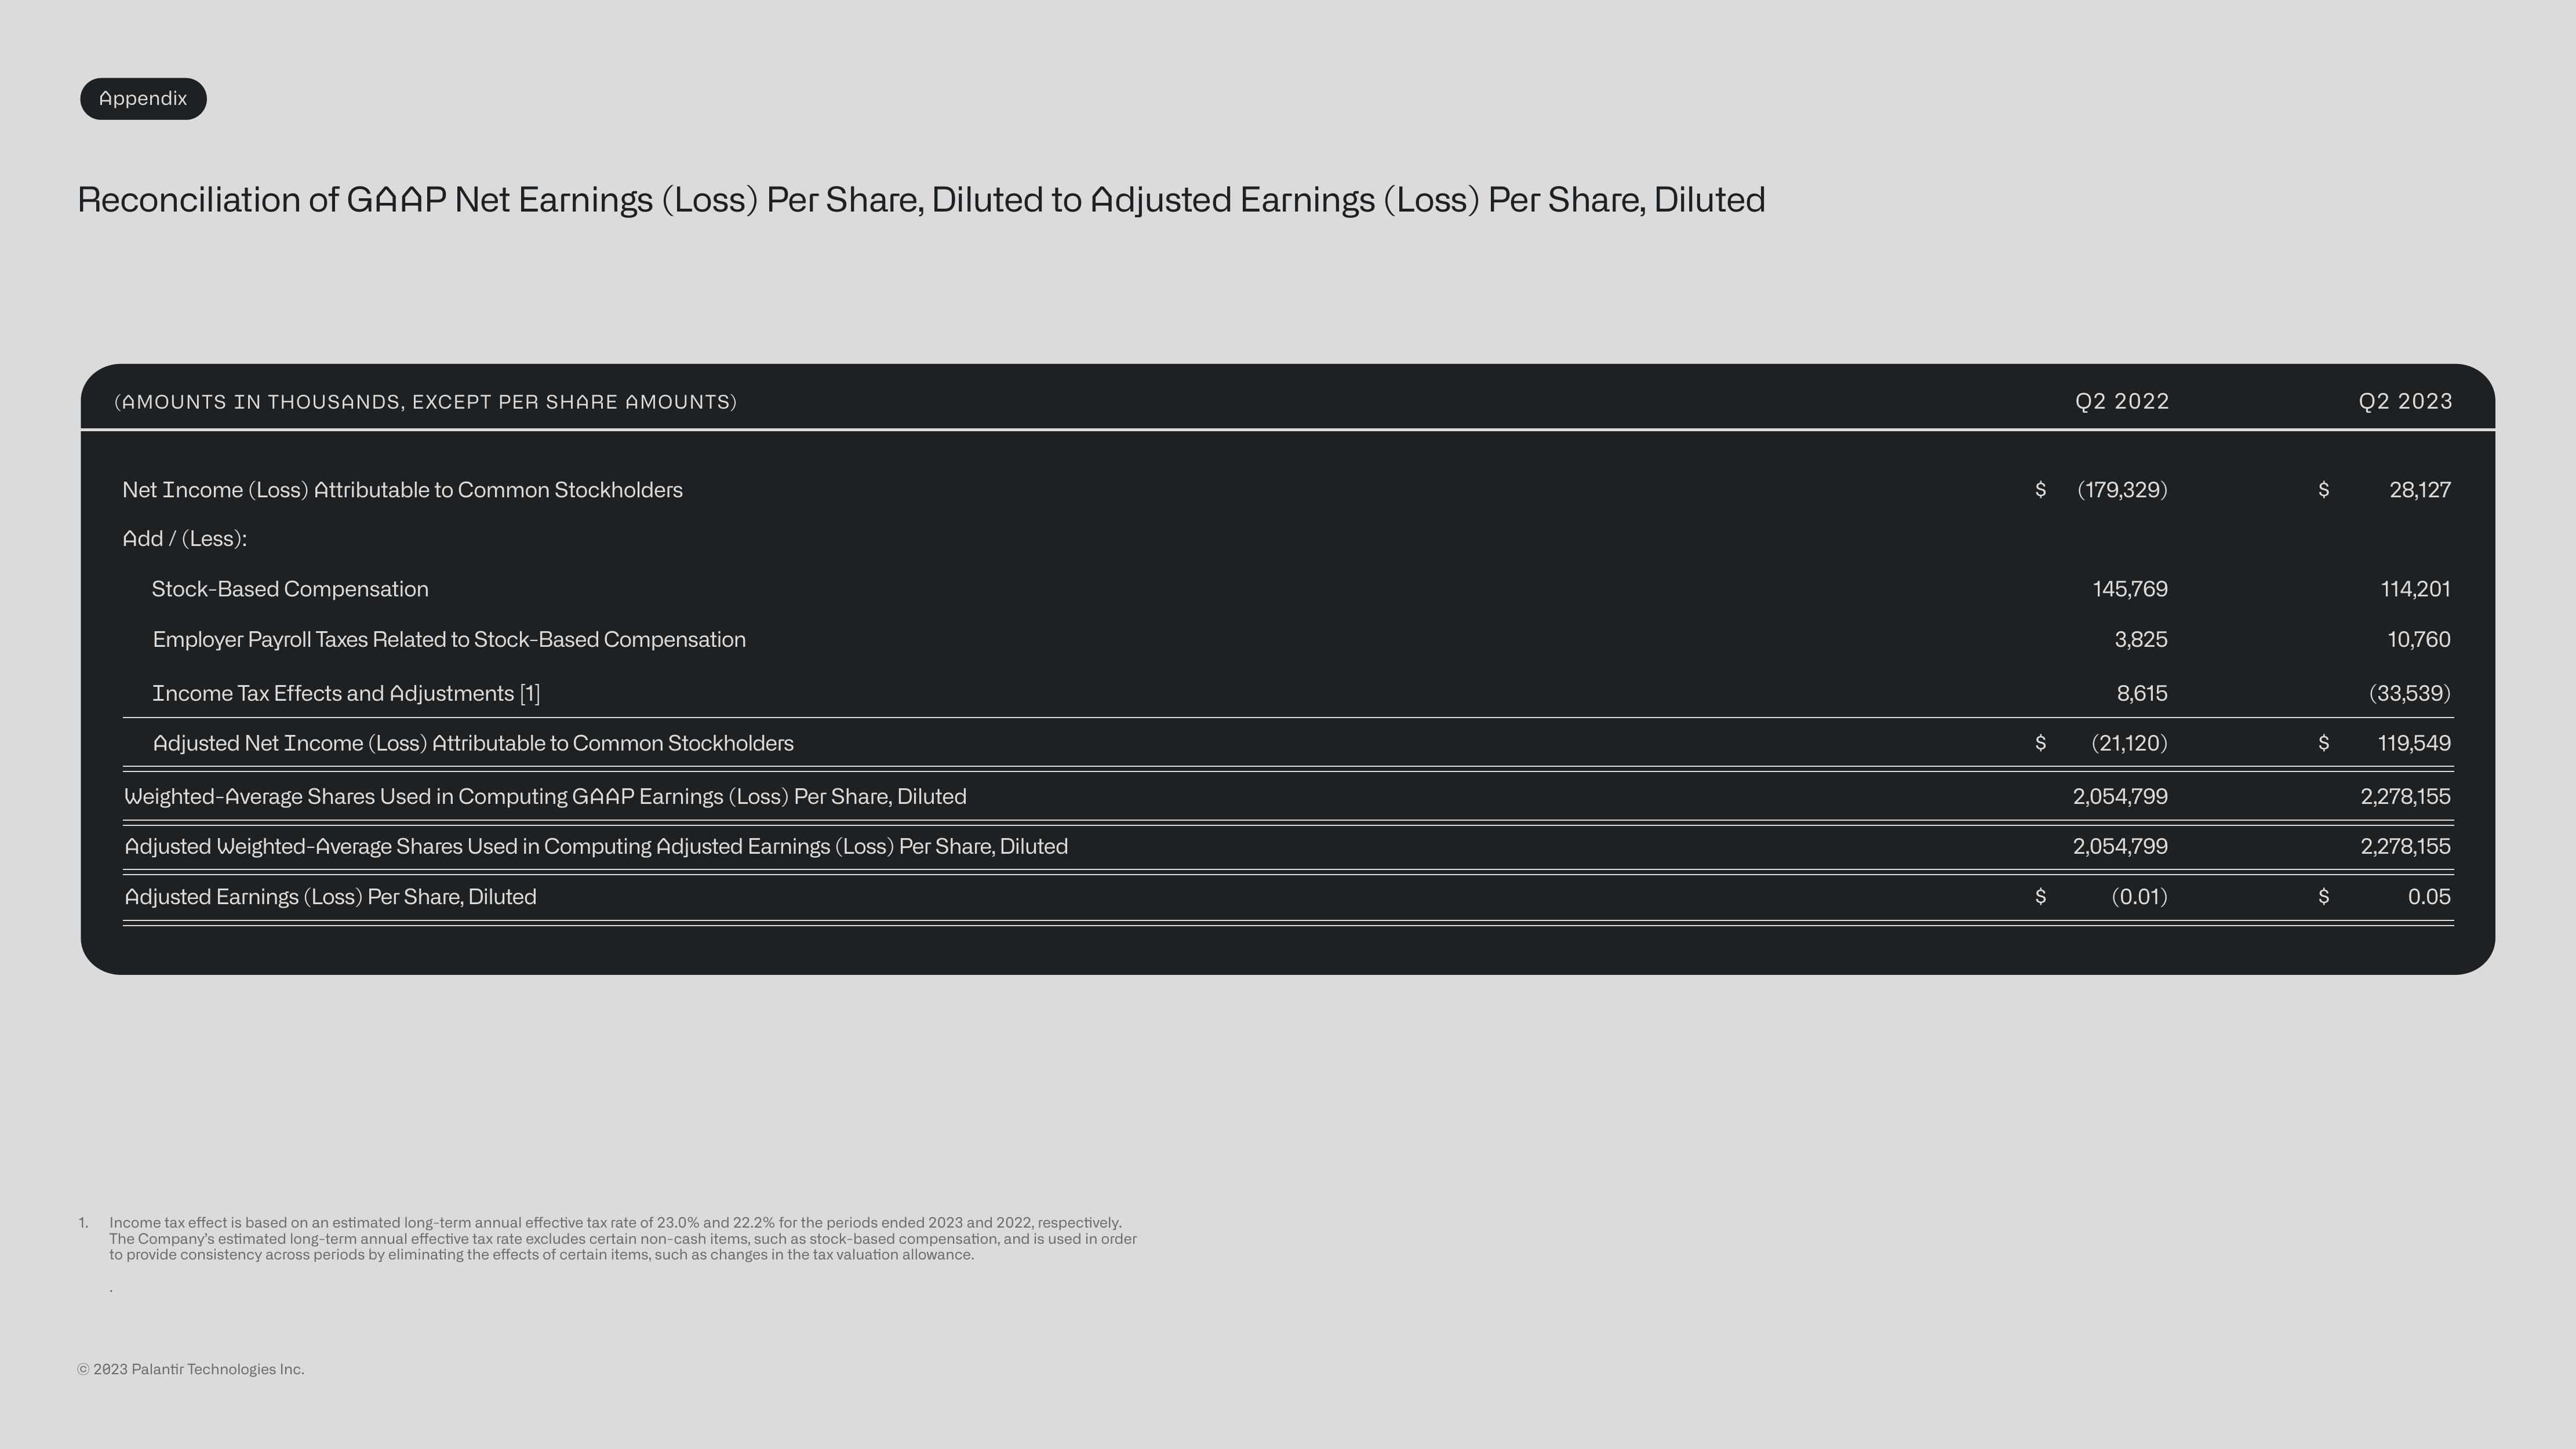
Reconciliation of GAAP Net Earnings (Loss) Per Share, Diluted to Adjusted Earnings (Loss) Per Share, Diluted
1.
(AMOUNTS IN THOUSANDS, EXCEPT PER SHARE AMOUNTS)
Net Income (Loss) Attributable to Common Stockholders
Add/ (Less):
Stock-Based Compensation
Employer Payroll Taxes Related to Stock-Based Compensation
Income Tax Effects and Adjustments [1]
Adjusted Net Income (Loss) Attributable to Common Stockholders
Weighted-Average Shares Used in Computing GAAP Earnings (Loss) Per Share, Diluted
Adjusted Weighted-Average Shares Used in Computing Adjusted Earnings (Loss) Per Share, Diluted
Adjusted Earnings (Loss) Per Share, Diluted
Income tax effect is based on an estimated long-term annual effective t rate of 23.0% and 22.2% for the periods ended 2023 and 2022, respectively.
The Company's estimated long-term annual effective tax rate excludes certain non-cash items, such as stock-based compensation, and is used in order
to provide consistency across periods by eliminating the effects of certain items, such as changes in the tax valuation allowance.
Ⓒ2023 Palantir Technologies Inc.
$
$
$
Q2 2022
(179,329)
145,769
3,825
8,615
(21,120)
2,054,799
2,054,799
(0.01)
$
$
$
Q2 2023
28,127
114,201
10,760
(33,539)
119,549
2,278,155
2,278,155
0.05View entire presentation