Paysafe Results Presentation Deck
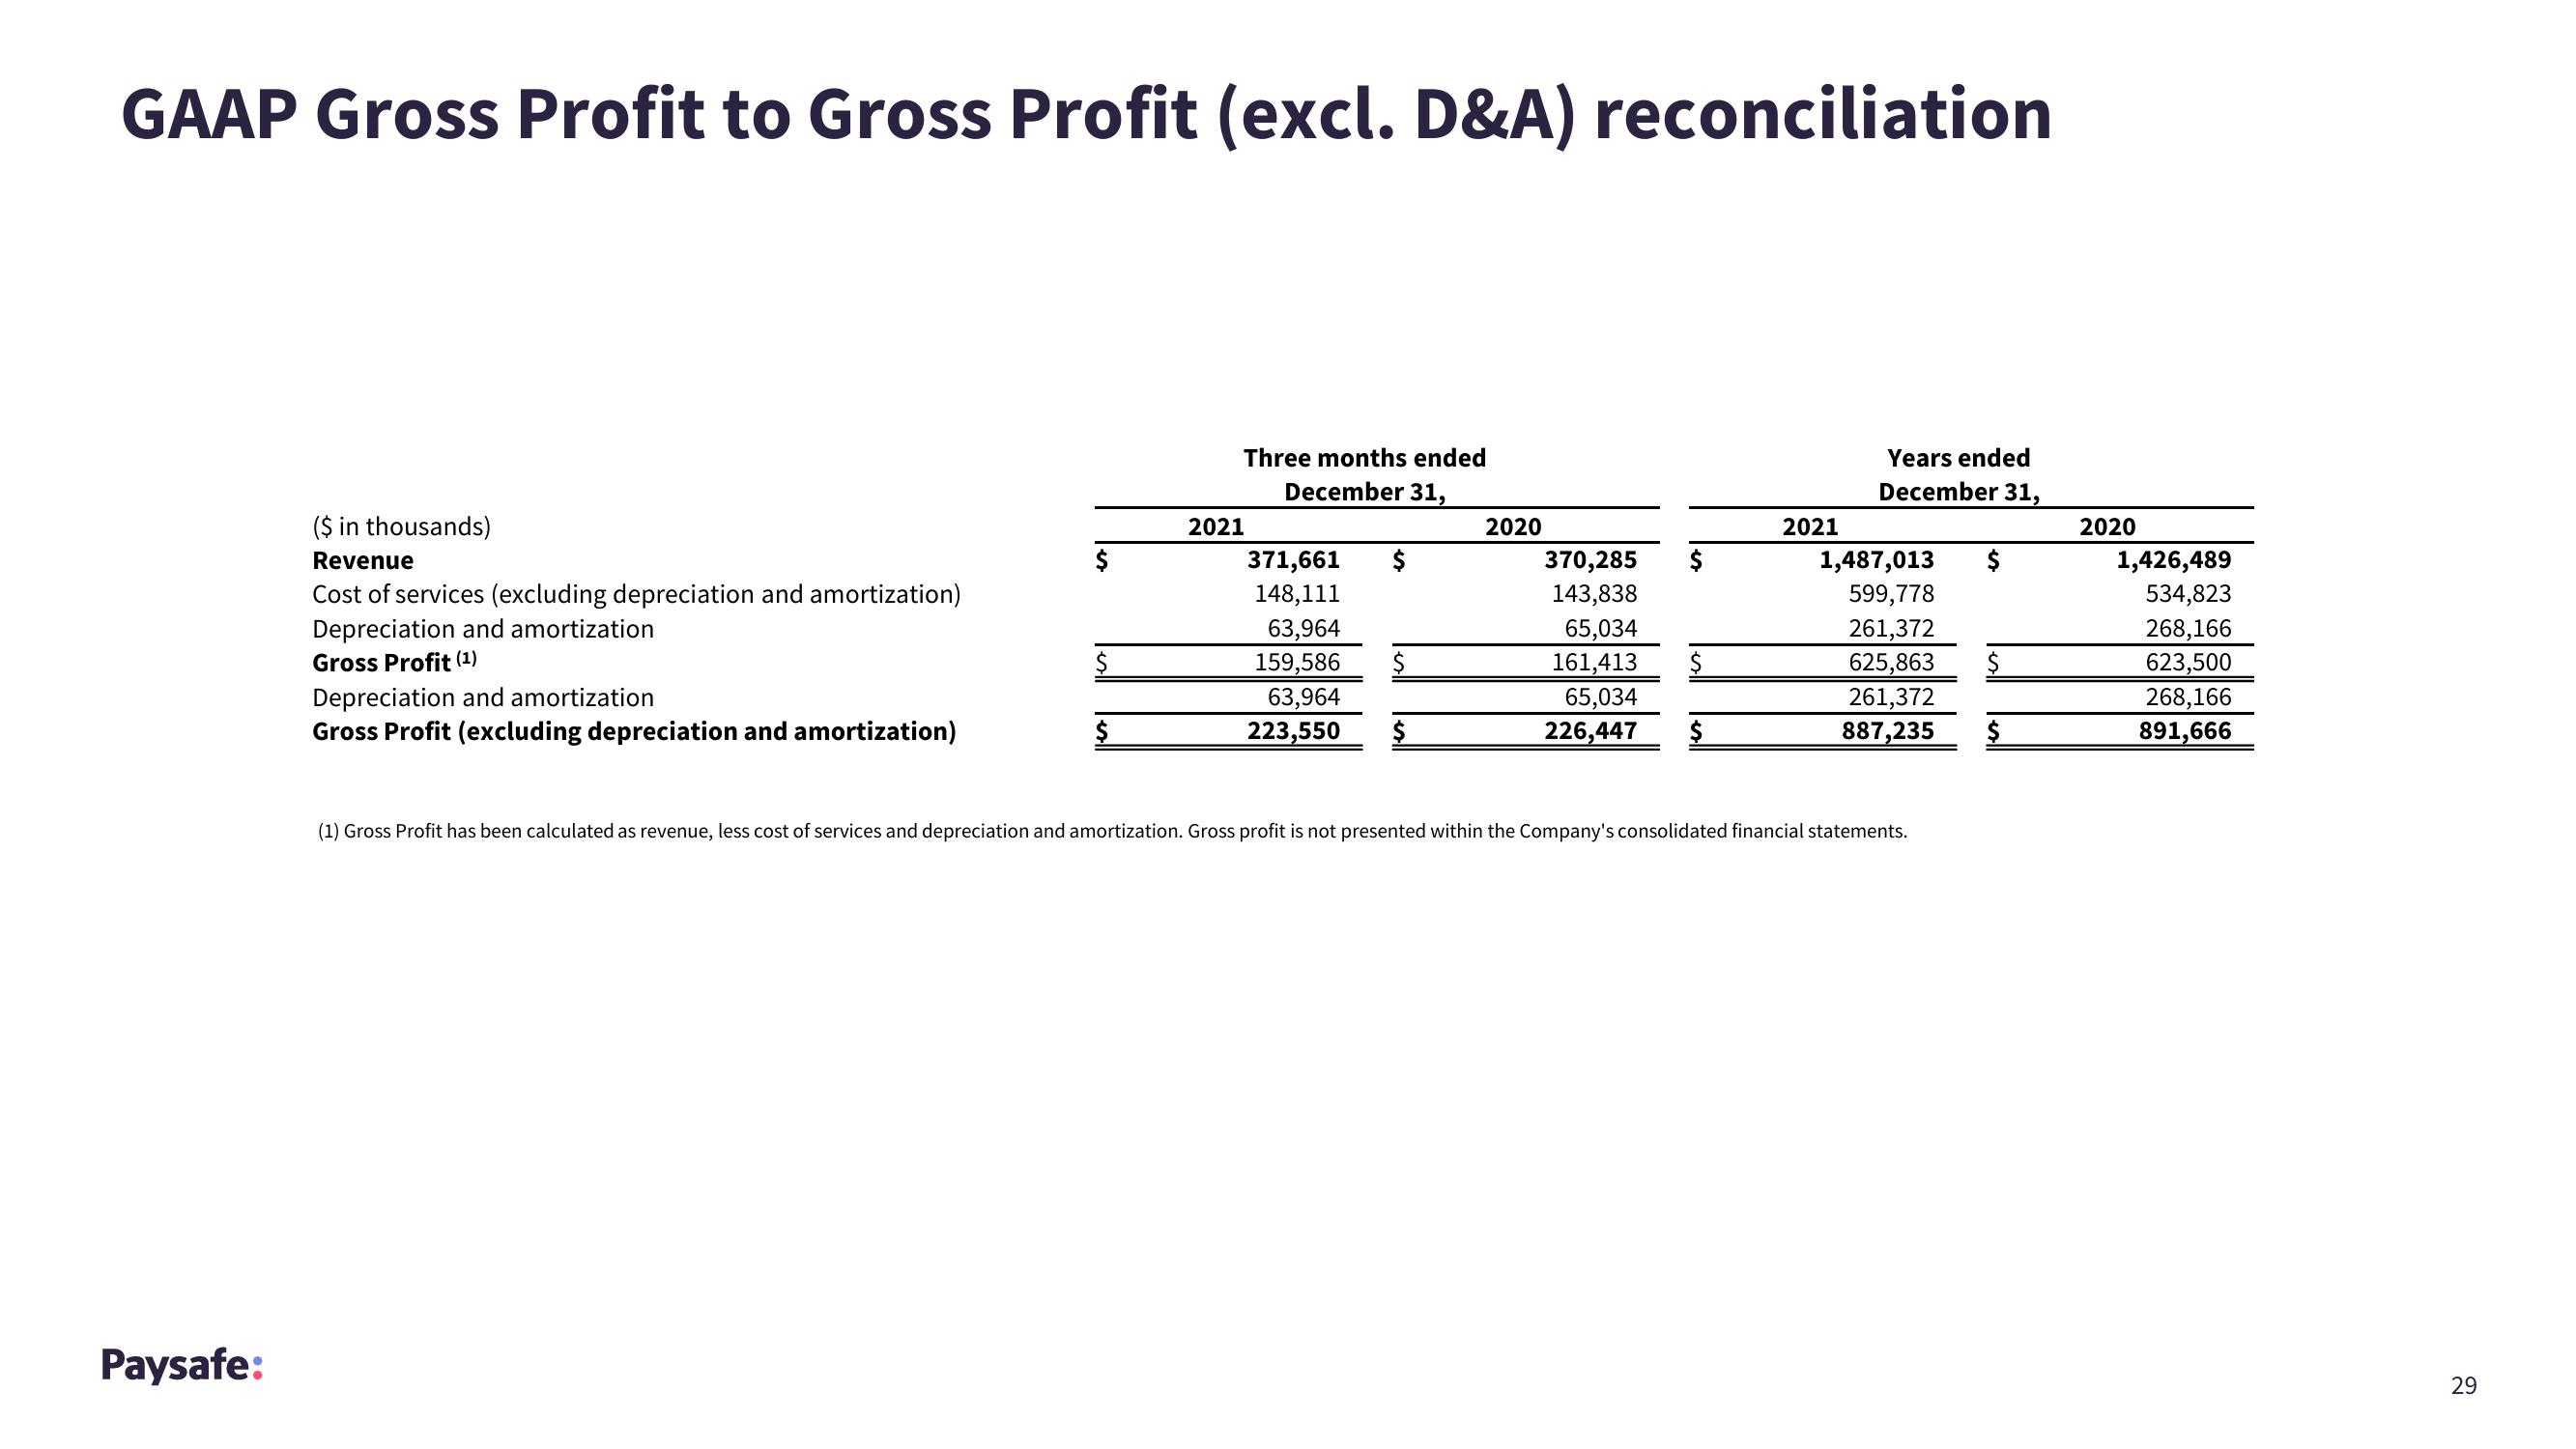
GAAP Gross Profit to Gross Profit (excl. D&A) reconciliation
Paysafe:
($ in thousands)
Revenue
Cost of services (excluding depreciation and amortization)
Depreciation and amortization
Gross Profit (¹)
Depreciation and amortization
Gross Profit (excluding depreciation and amortization)
$
Three months ended
December 31,
2021
371,661
148,111
63,964
159,586
63,964
223,550
$
2020
370,285
143,838
65,034
161,413
65,034
226,447
$
$
2021
Years ended
December 31,
1,487,013
599,778
261,372
625,863 $
261,372
887,235
(1) Gross Profit has been calculated as revenue, less cost of services and depreciation and amortization. Gross profit is not presented within the Company's consolidated financial statements.
2020
1,426,489
534,823
268,166
623,500
268,166
891,666
29View entire presentation