Pershing Square Activist Presentation Deck
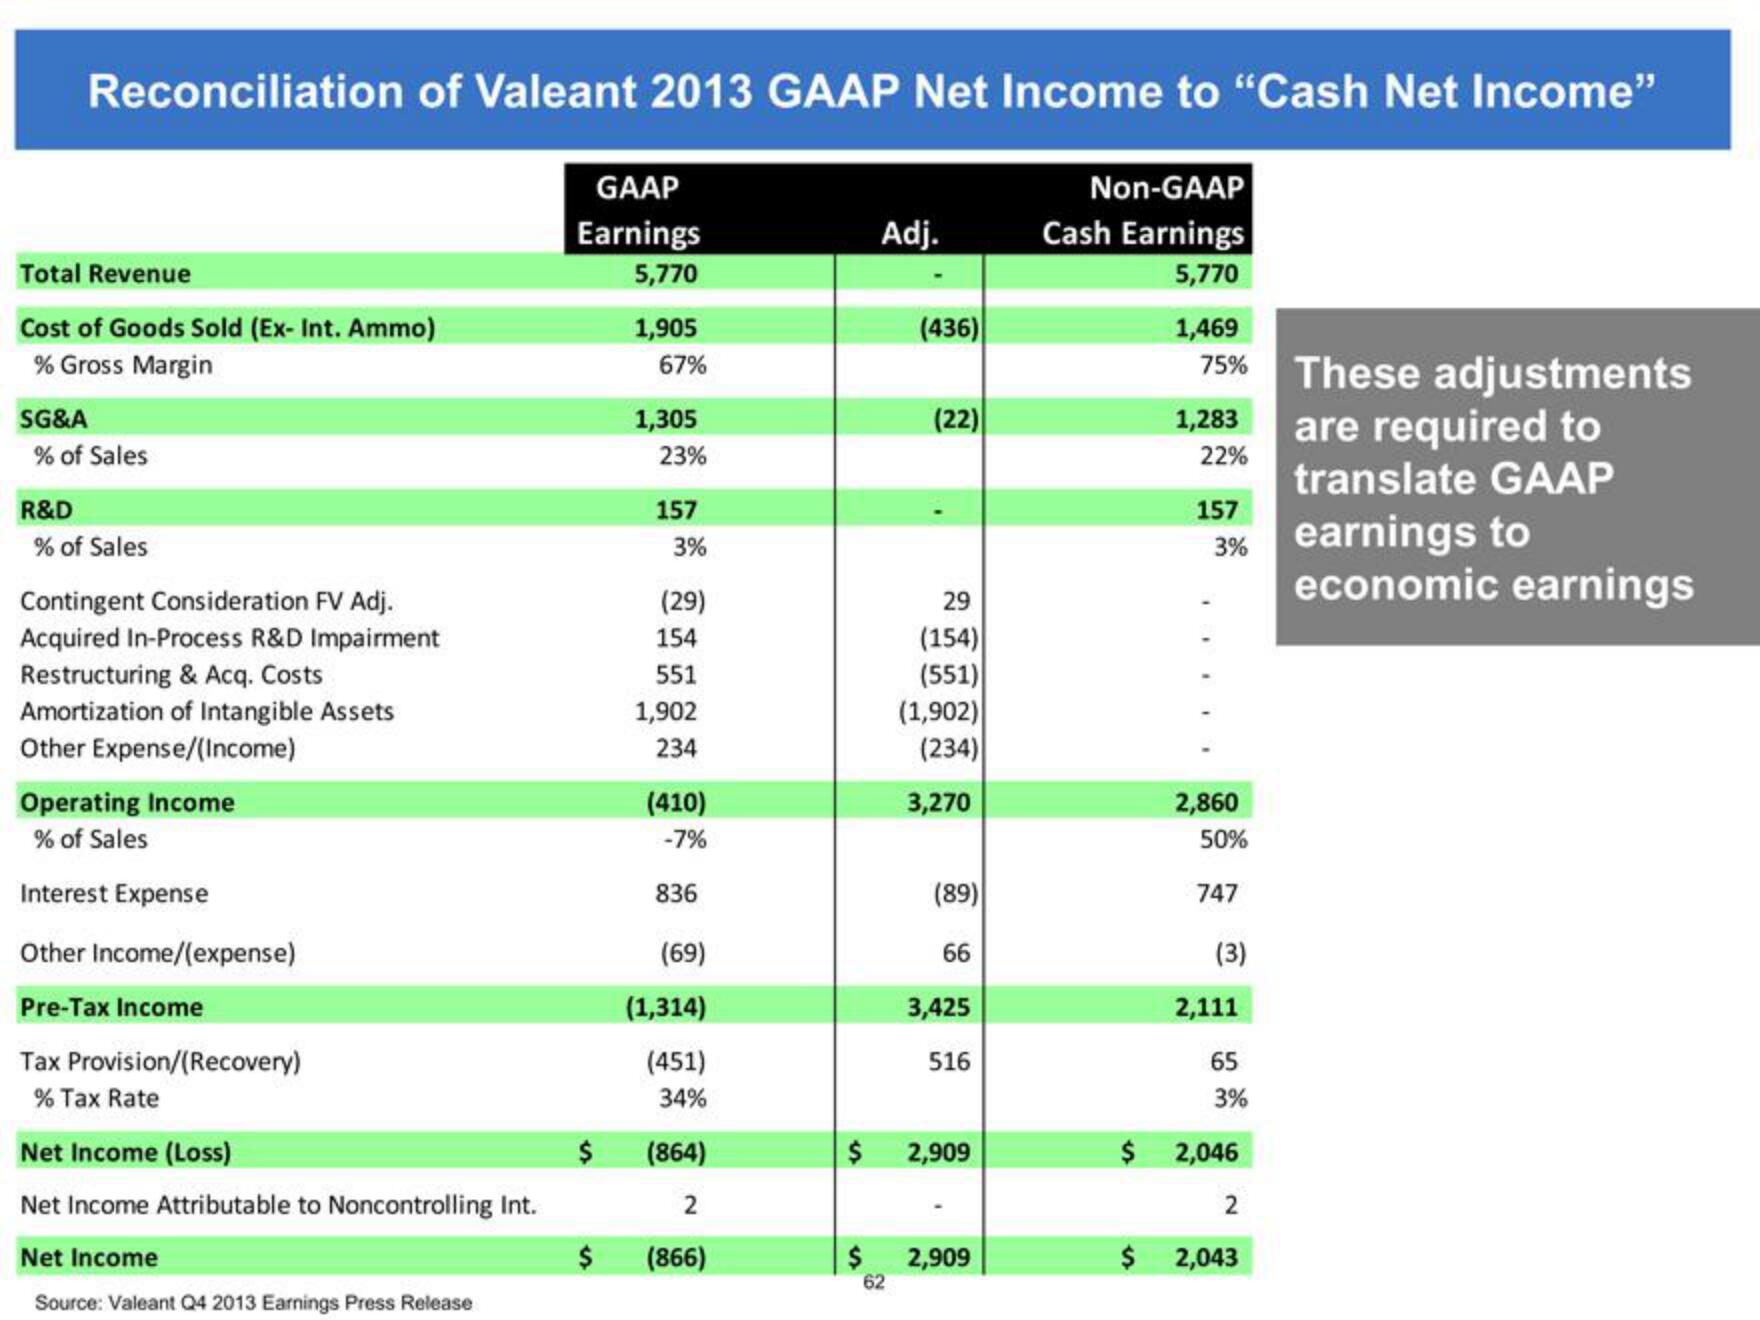
Reconciliation of Valeant 2013 GAAP Net Income to "Cash Net Income"
Total Revenue
Cost of Goods Sold (Ex- Int. Ammo)
% Gross Margin
SG&A
% of Sales
R&D
% of Sales
Contingent Consideration FV Adj.
Acquired In-Process R&D Impairment
Restructuring & Acq. Costs
Amortization of Intangible Assets
Other Expense/(Income)
Operating Income
% of Sales
Interest Expense
Other Income/(expense)
Pre-Tax Income
Tax Provision/(Recovery)
% Tax Rate
Net Income (Loss)
Net Income Attributable to Noncontrolling Int.
Net Income
Source: Valeant Q4 2013 Earnings Press Release
GAAP
Earnings
5,770
$
$
1,905
67%
1,305
23%
157
3%
(29)
154
551
1,902
234
(410)
-7%
836
(69)
(1,314)
(451)
34%
(864)
2
(866)
Adj.
$
(436)
62
(22)
29
(154)
(551)
(1,902)
(234)
3,270
(89)
66
$ 2,909
3,425
516
2,909
Non-GAAP
Cash Earnings
5,770
1,469
1,283
22%
2,860
50%
157
3% earnings to
747
(3)
2,111
65
3%
$ 2,046
2
These adjustments
are required to
$ 2,043
translate GAAP
economic earningsView entire presentation