Grab Results Presentation Deck
2021 Q1 Results
Consolidated Group
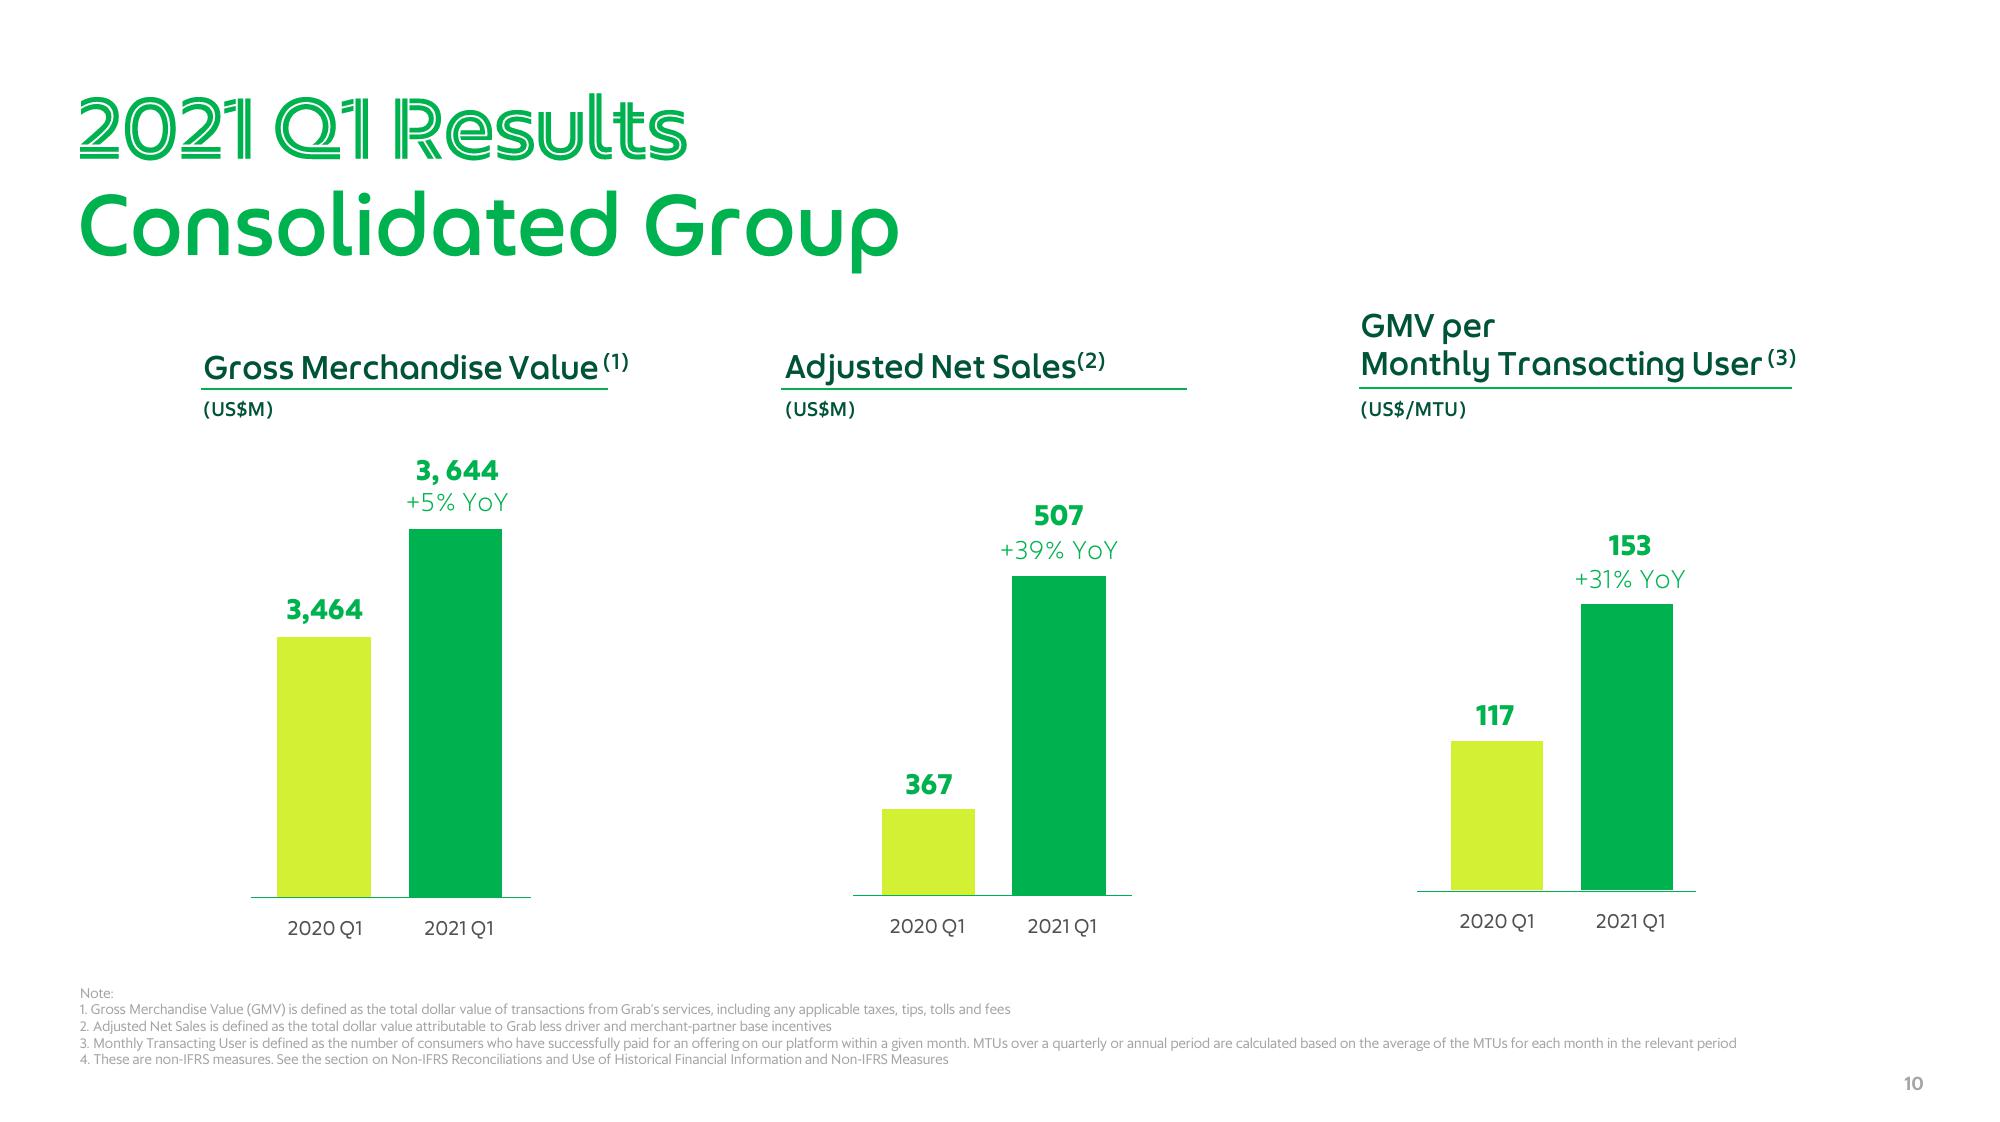
Gross Merchandise Value (¹)
(US$M)
3,464
2020 Q1
3,644
+5% YOY
2021 Q1
Adjusted Net Sales(2)
(US$M)
367
2020 Q1
507
+39% YOY
Note:
1. Gross Merchandise Value (GMV) is defined as the total dollar value of transactions from Grab's services, including any applicable taxes, tips, tolls and fees
2. Adjusted Net Sales is defined as the total dollar value attributable to Grab less driver and merchant-partner base incentives
2021 Q1
GMV per
Monthly Transacting User (3)
(US$/MTU)
117
2020 Q¹1
153
+31% YOY
2021 Q1
3. Monthly Transacting User is defined as the number of consumers who have successfully paid for an offering on our platform within a given month. MTUS over a quarterly or annual period are calculated based on the average of the MTUs for each month in the relevant period
4. These are non-IFRS measures. See the section on Non-IFRS Reconciliations and Use Historical Financial Information and Non-IFRS Measures
10View entire presentation