TPG Results Presentation Deck
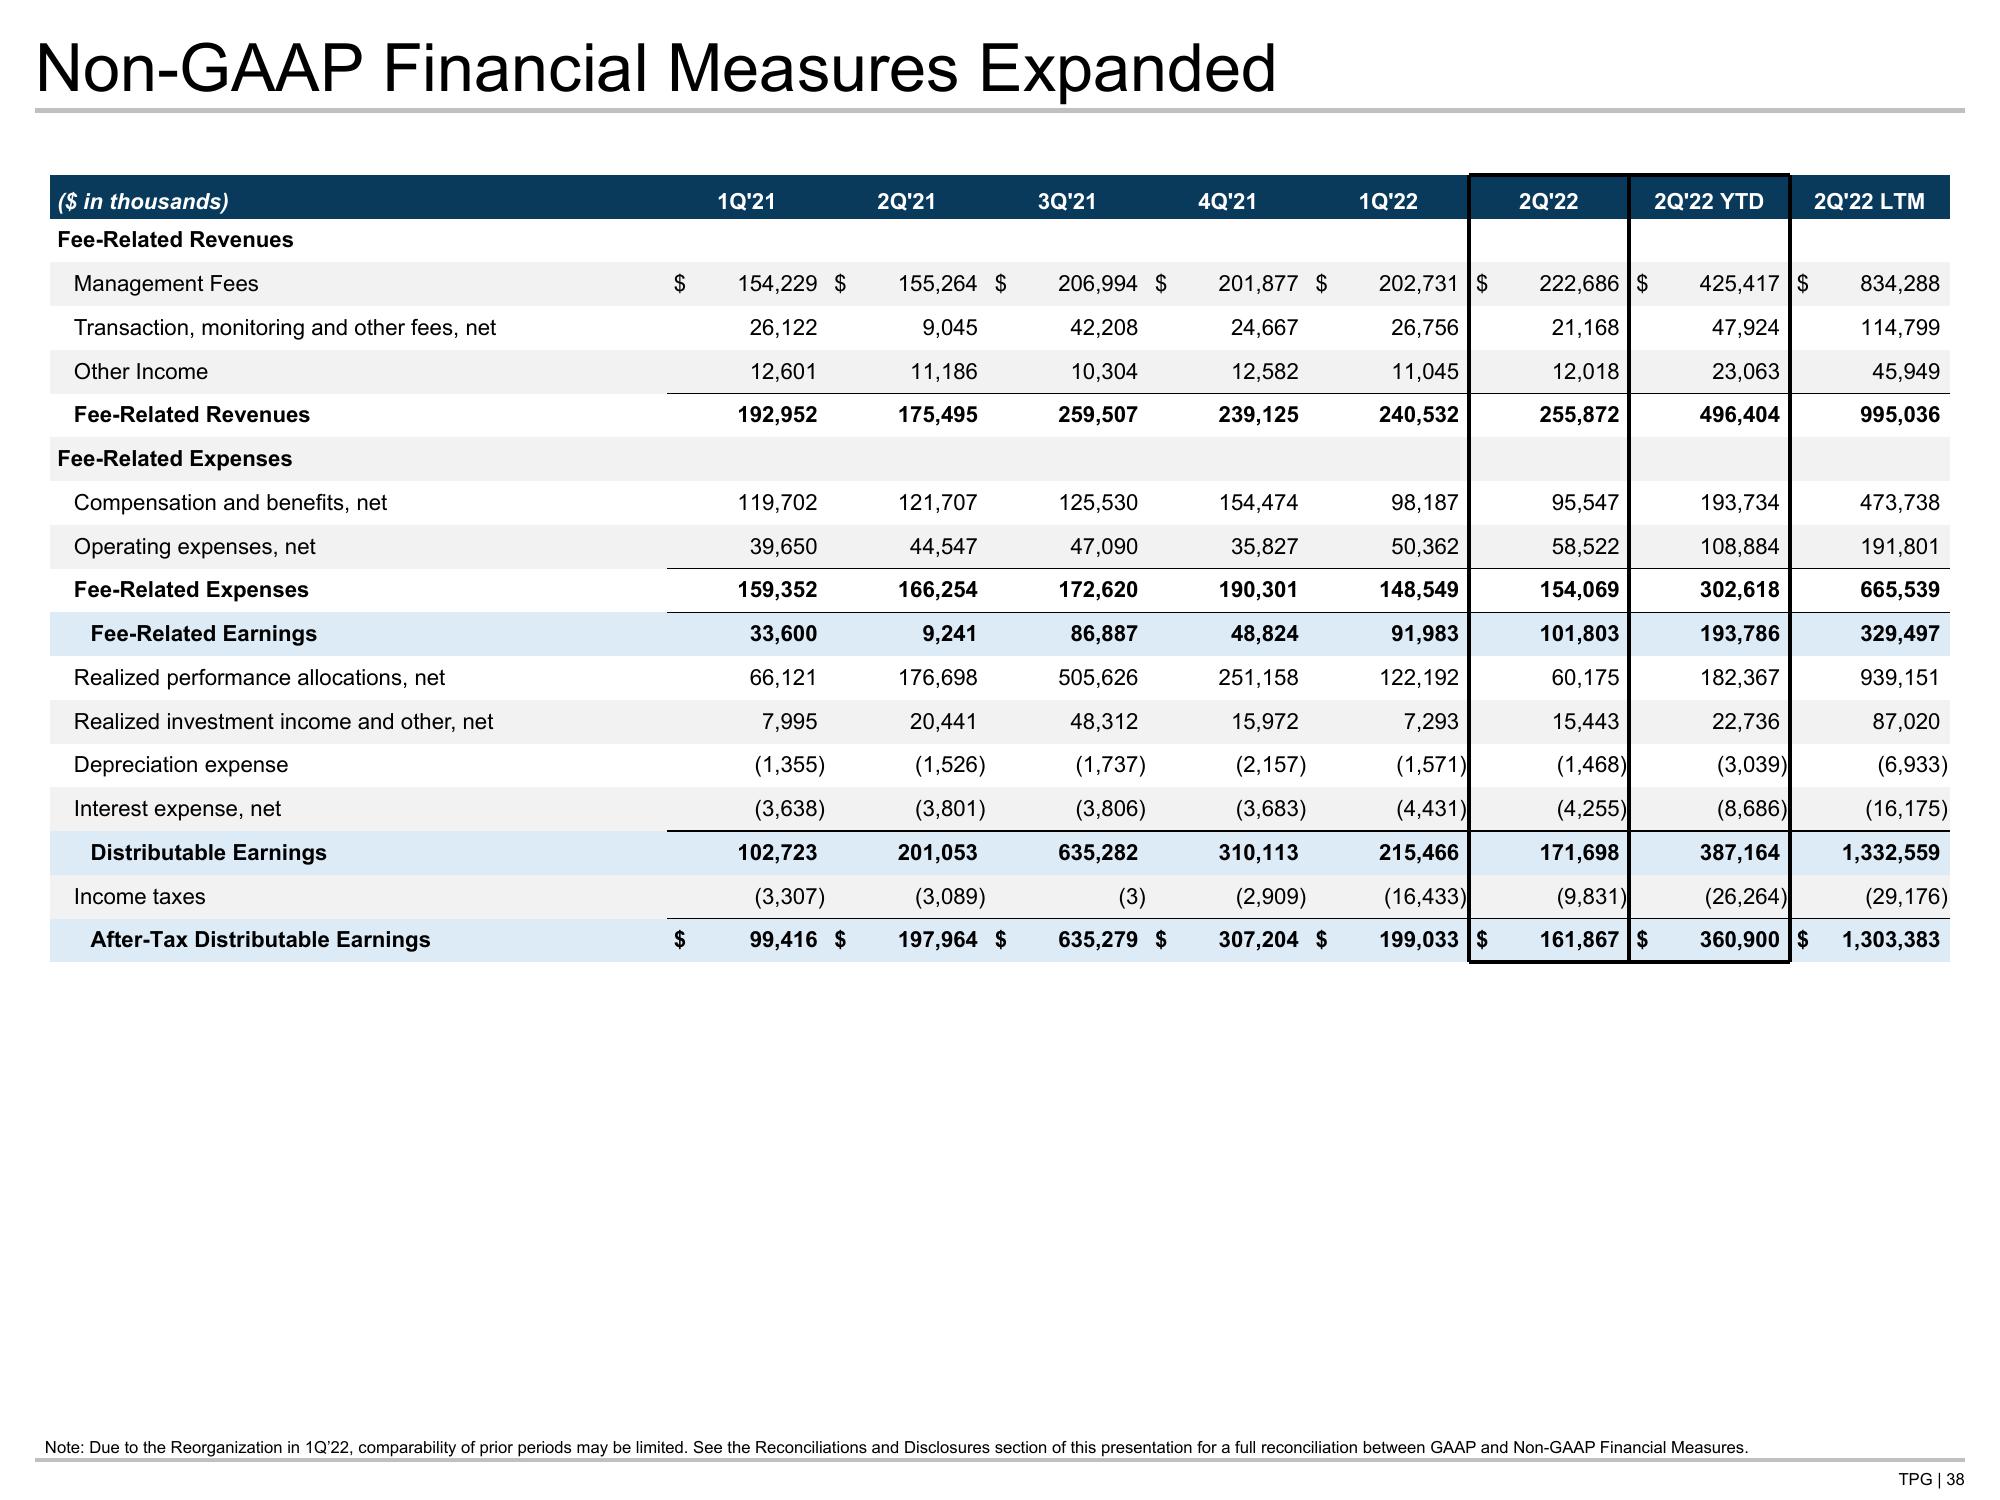
Non-GAAP Financial Measures Expanded
($ in thousands)
Fee-Related Revenues
Management Fees
Transaction, monitoring and other fees, net
Other Income
Fee-Related Revenues
Fee-Related Expenses
Compensation and benefits, net
Operating expenses, net
Fee-Related Expenses
Fee-Related Earnings
Realized performance allocations, net
Realized investment income and other, net
Depreciation expense
Interest expense, net
Distributable Earnings
Income taxes
After-Tax Distributable Earnings
$
$
1Q'21
154,229 $
26,122
12,601
192,952
119,702
39,650
159,352
33,600
66,121
7,995
(1,355)
(3,638)
102,723
(3,307)
99,416 $
2Q'21
155,264 $
9,045
11,186
175,495
121,707
44,547
166,254
9,241
176,698
20,441
(1,526)
(3,801)
3Q'21
206,994 $
42,208
10,304
259,507
125,530
47,090
172,620
86,887
505,626
48,312
(1,737)
(3,806)
635,282
4Q'21
201,877 $
24,667
12,582
239,125
154,474
35,827
190,301
48,824
251,158
15,972
(2,157)
(3,683)
201,053
310,113
(3,089)
(3)
(2,909)
197,964 $ 635,279 $ 307,204 $
1Q'22
2Q'22
202,731 $ 222,686 $ 425,417 $
26,756
21,168
47,924
11,045
12,018
23,063
240,532
255,872
496,404
98,187
50,362
148,549
91,983
122, 192
7,293
(1,571)
(4,431)
215,466
171,698
(16,433)
(9,831)
199,033 $ 161,867 $
95,547
58,522
154,069
101,803
60,175
15,443
(1,468)
(4,255)
2Q'22 YTD
2Q'22 LTM
Note: Due to the Reorganization in 1Q'22, comparability of prior periods may be limited. See the Reconciliations and Disclosures section of this presentation for a full reconciliation between GAAP and Non-GAAP Financial Measures.
834,288
114,799
45,949
995,036
193,734
473,738
108,884
191,801
302,618
665,539
193,786
329,497
182,367
939,151
22,736
87,020
(3,039)
(6,933)
(8,686)
(16,175)
387,164
1,332,559
(29,176)
(26,264)
360,900 $ 1,303,383
TPG | 38View entire presentation