Bed Bath & Beyond Results Presentation Deck
I
Fourth Quarter Highlights
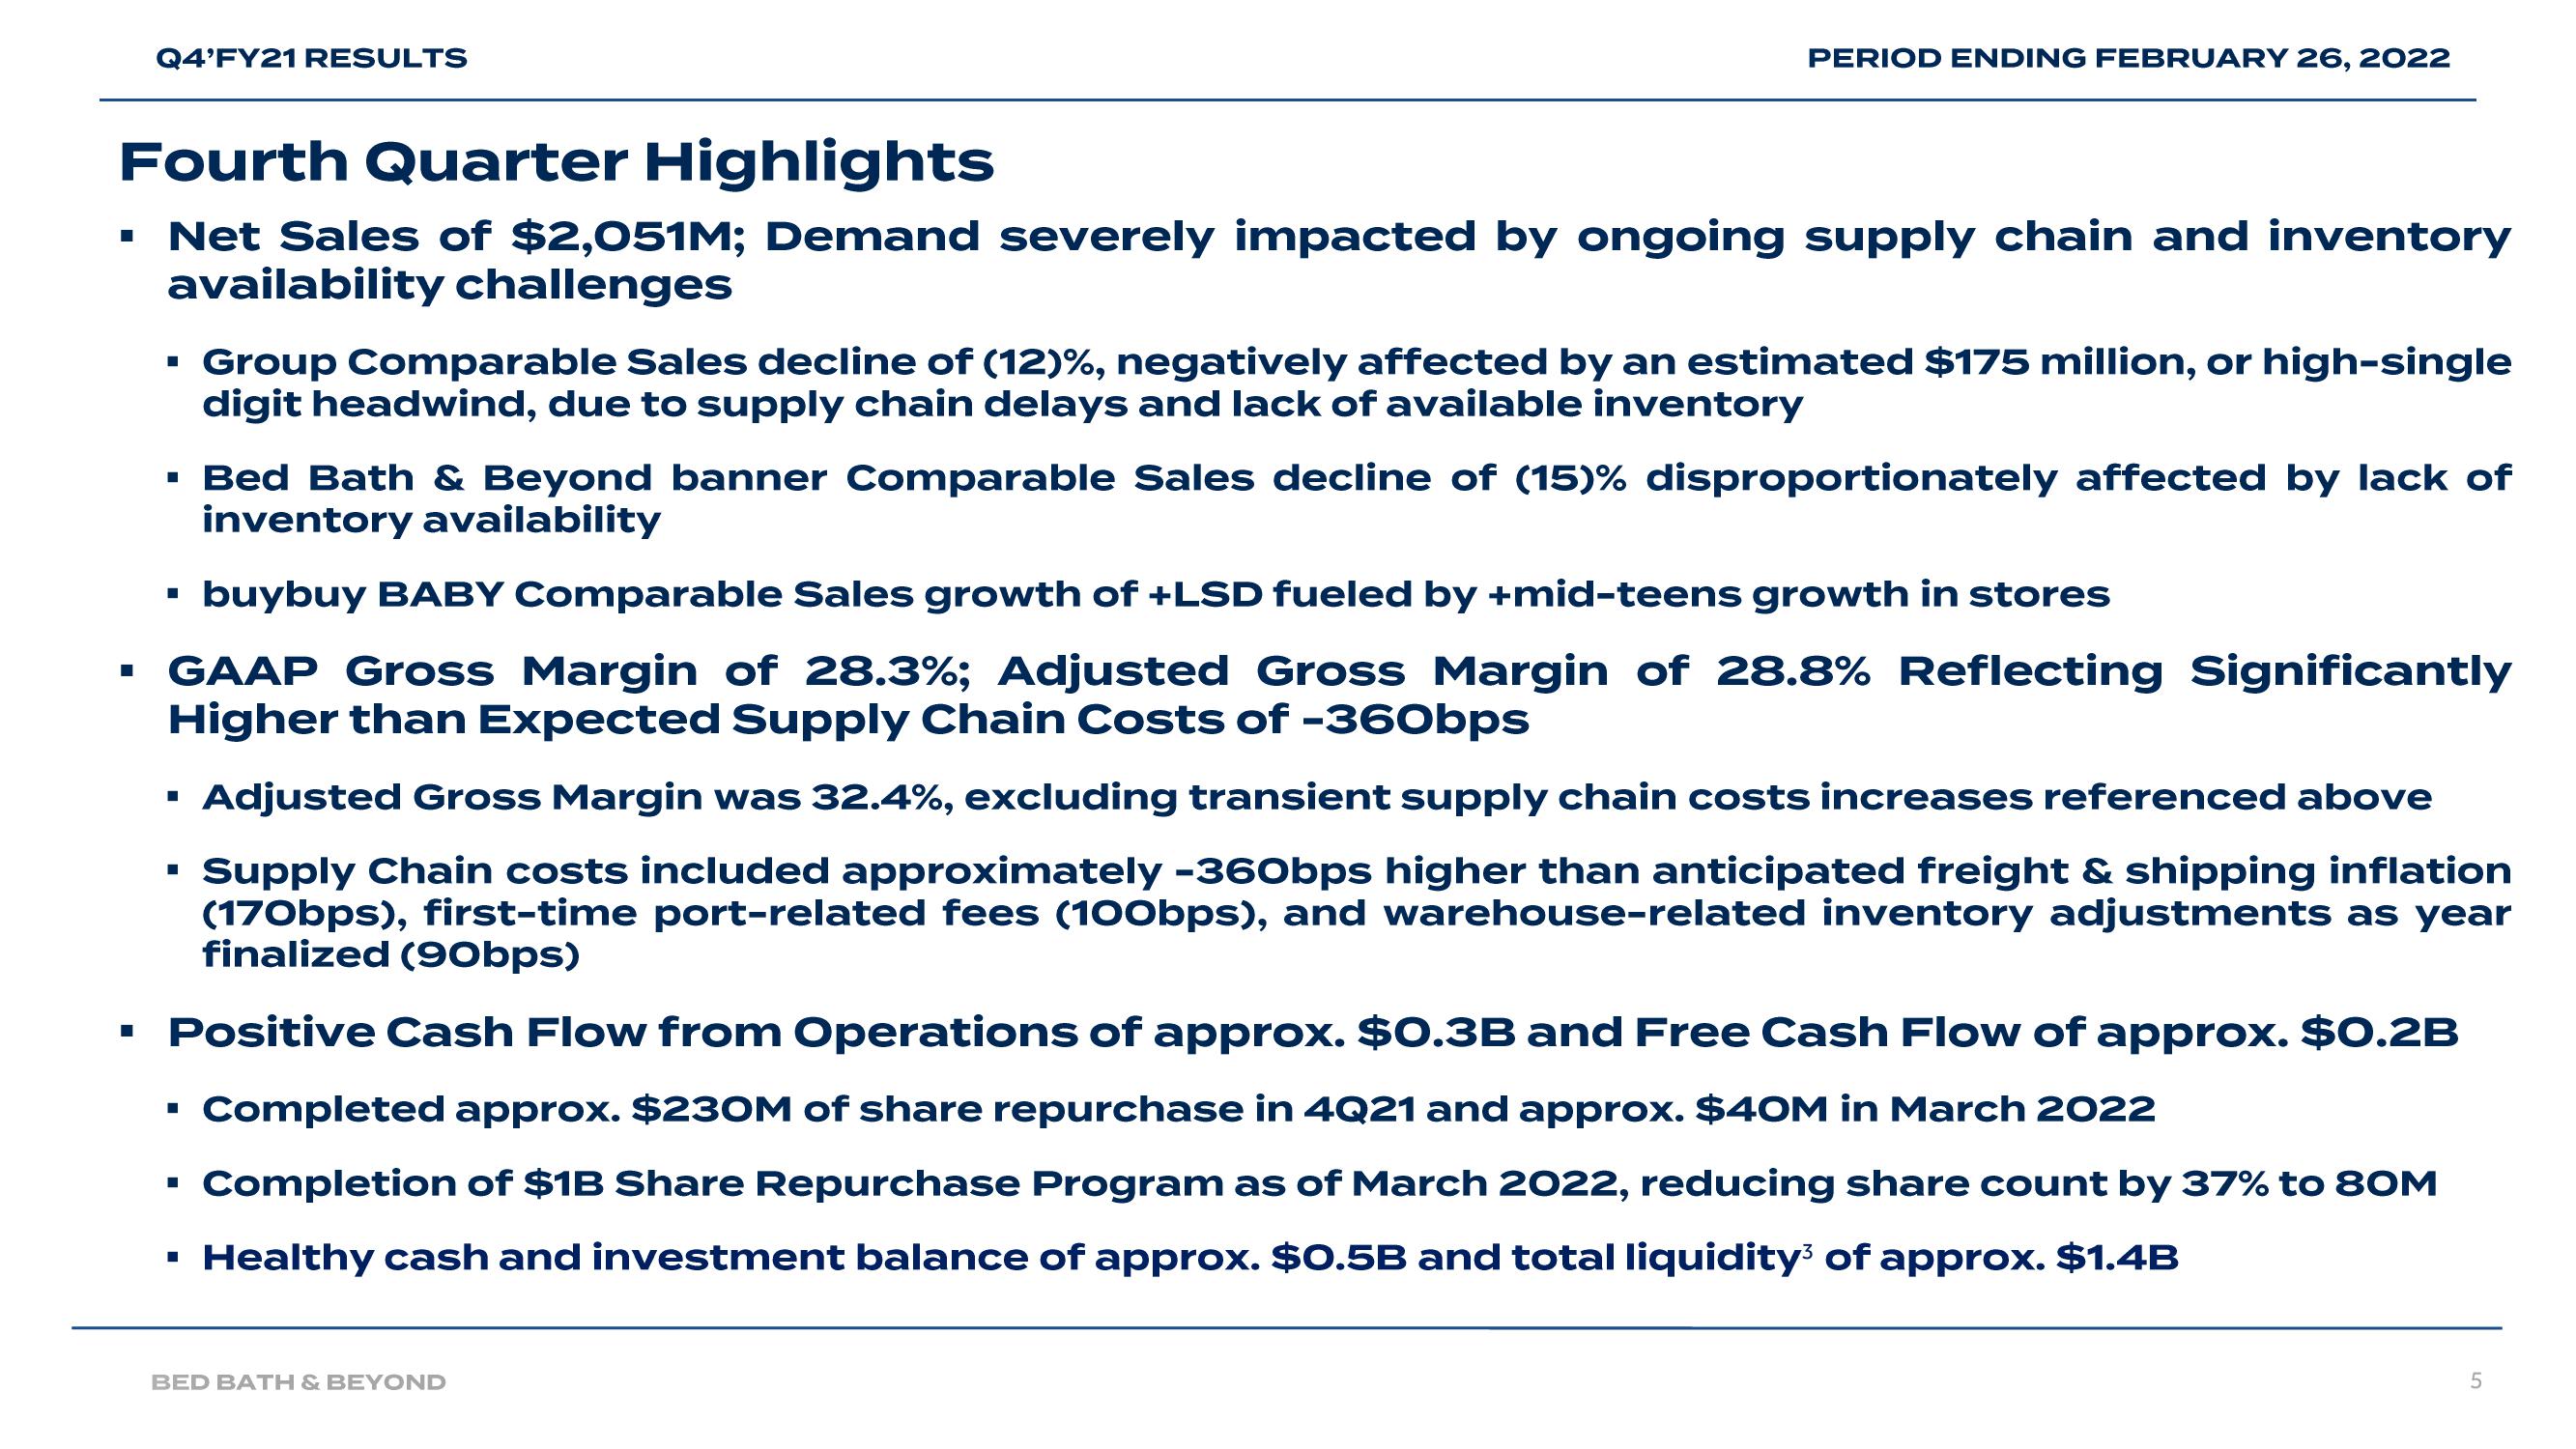
Net Sales of $2,051M; Demand severely impacted by ongoing supply chain and inventory
availability challenges
■
Q4'FY21 RESULTS
■
I
▪ Group Comparable Sales decline of (12)%, negatively affected by an estimated $175 million, or high-single
digit headwind, due to supply chain delays and lack of available inventory
▪ Bed Bath & Beyond banner Comparable Sales decline of (15)% disproportionately affected by lack of
inventory availability
buybuy BABY Comparable Sales growth of +LSD fueled by +mid-teens growth in stores
GAAP Gross Margin of 28.3%; Adjusted Gross Margin of 28.8% Reflecting Significantly
Higher than Expected Supply Chain Costs of -360bps
■
PERIOD ENDING FEBRUARY 26, 2022
■
Adjusted Gross Margin was 32.4%, excluding transient supply chain costs increases referenced above
I
▪ Supply Chain costs included approximately -360bps higher than anticipated freight & shipping inflation
(170bps), first-time port-related fees (100bps), and warehouse-related inventory adjustments as year
finalized (90bps)
Positive Cash Flow from Operations of approx. $0.3B and Free Cash Flow of approx. $0.2B
Completed approx. $230M of share repurchase in 4Q21 and approx. $40M in March 2022
Completion of $1B Share Repurchase Program as of March 2022, reducing share count by 37% to 80M
Healthy cash and investment balance of approx. $0.5B and total liquidity of approx. $1.4B
I
I
BED BATH & BEYOND
5View entire presentation