Bausch+Lomb Results Presentation Deck
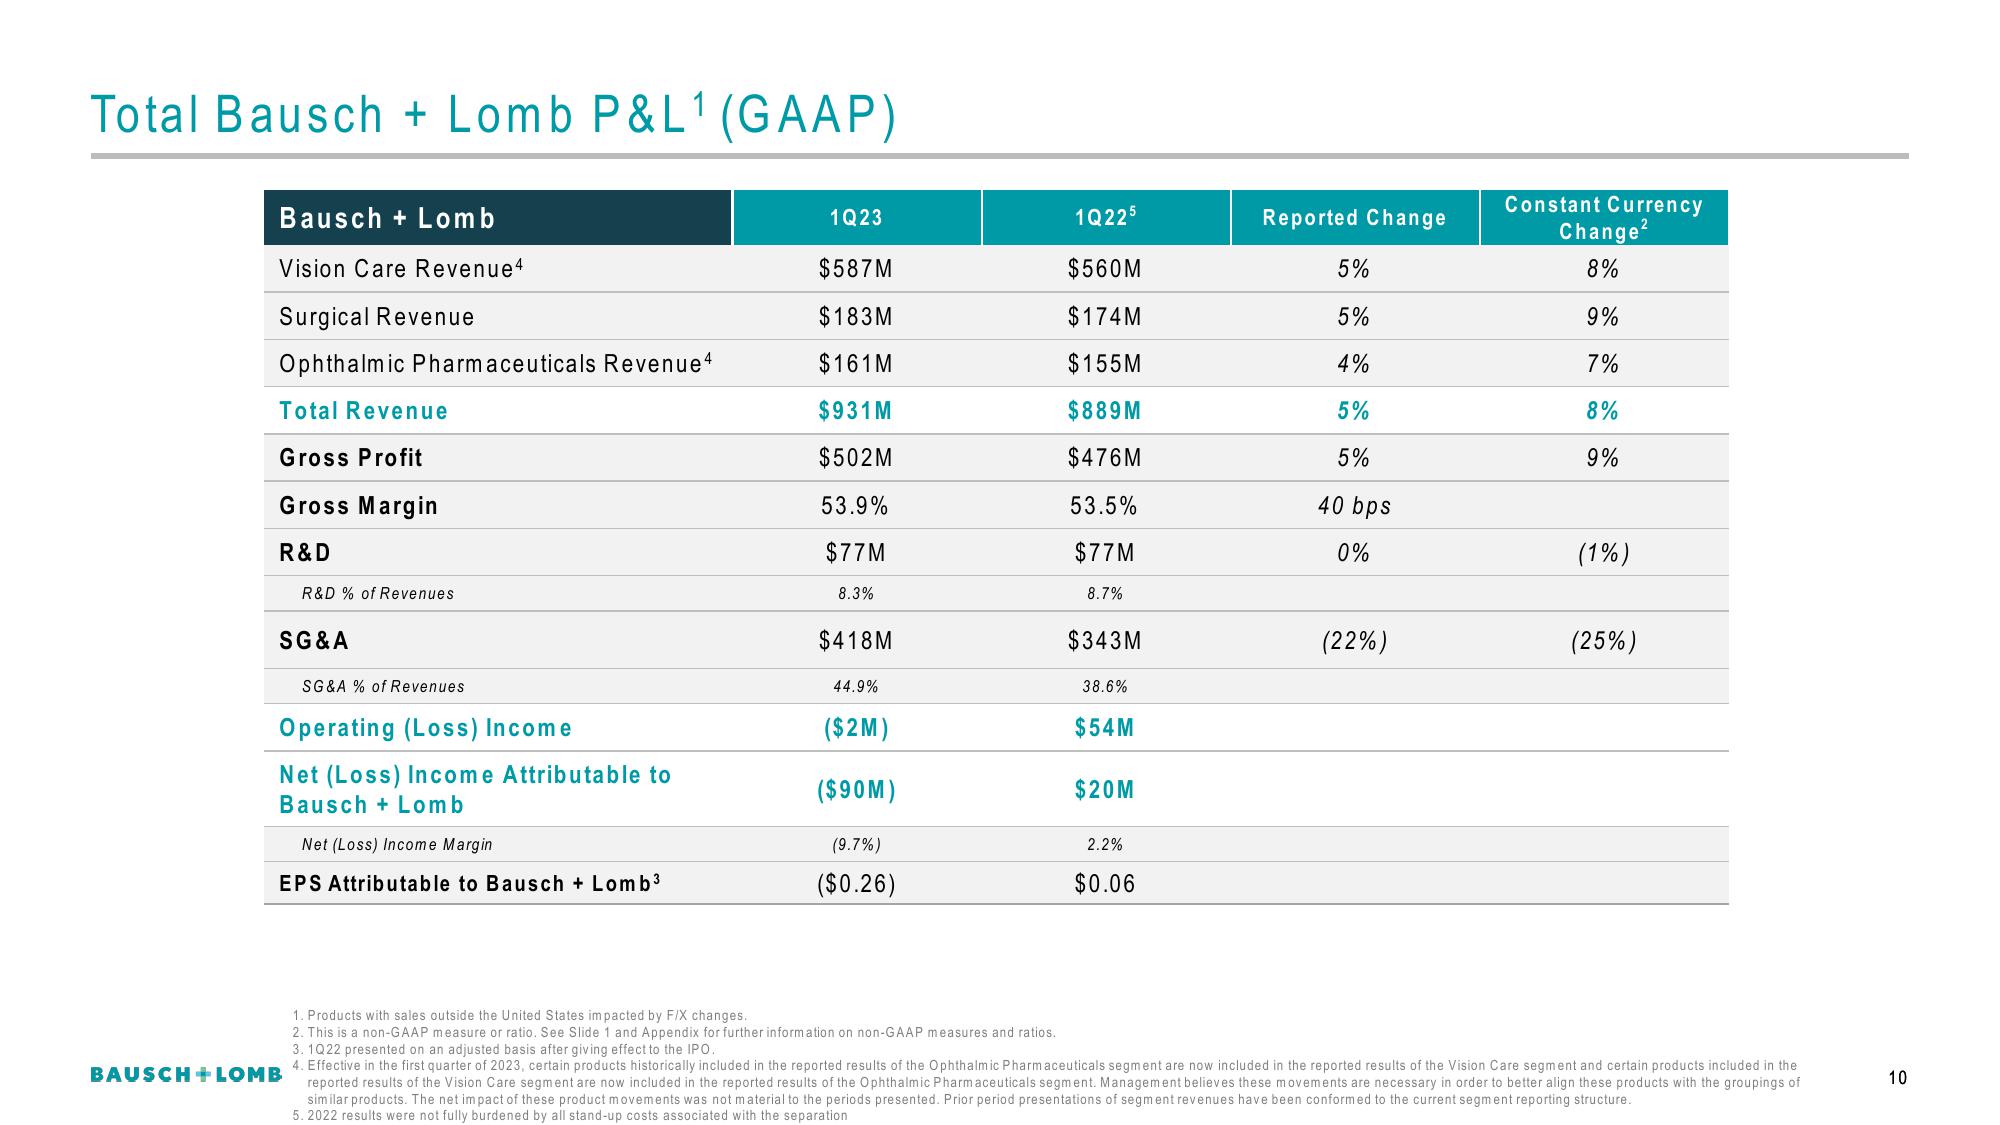
Total Bausch + Lomb P&L¹ (GAAP)
Bausch + Lomb
Vision Care Revenue4
Surgical Revenue
Ophthalmic Pharmaceuticals Revenue4
Total Revenue
Gross Profit
Gross Margin
R&D
R&D % of Revenues
SG & A
SG&A % of Revenues
Operating (Loss) Income
Net (Loss) Income Attributable to
Bausch + Lomb
Net (Loss) Income Margin
EPS Attributable to Bausch + Lomb³
BAUSCH + LOMB
1Q23
$587M
$183M
$161 M
$931 M
$502M
53.9%
$77M
8.3%
$418M
44.9%
($2M)
($90M)
(9.7%)
($0.26)
1Q225
$560M
$174M
$155M
$889M
$476M
53.5%
$77M
8.7%
$343M
38.6%
$54M
$20M
2.2%
$0.06
Reported Change
5%
5%
4%
5%
5%
40 bps
0%
(22%)
Constant Currency
Change²
8%
9%
7%
8%
9%
(1%)
(25%)
1. Products with sales outside the United States impacted by F/X changes.
2. This is a non-GAAP measure or ratio. See Slide 1 and Appendix for further information on non-GAAP measures and ratios.
3. 1Q22 presented on an adjusted basis after giving effect to the IPO.
4. Effective in the first quarter of 2023, certain products historically included in the reported results of the Ophthalmic Pharmaceuticals segment are now included in the reported results of the Vision Care segment and certain products included in the
reported results of the Vision Care segment are now included in the reported results of the Ophthalmic Pharmaceuticals segment. Management believes these movements are necessary in order to better align these products with the groupings of
similar products. The net impact of these product movements was not material to the periods presented. Prior period presentations of segment revenues have been conformed to the current segment reporting structure.
5.2022 results were not fully burdened by all stand-up costs associated with the separation
10View entire presentation