Grab Results Presentation Deck
Q3 2021 Results
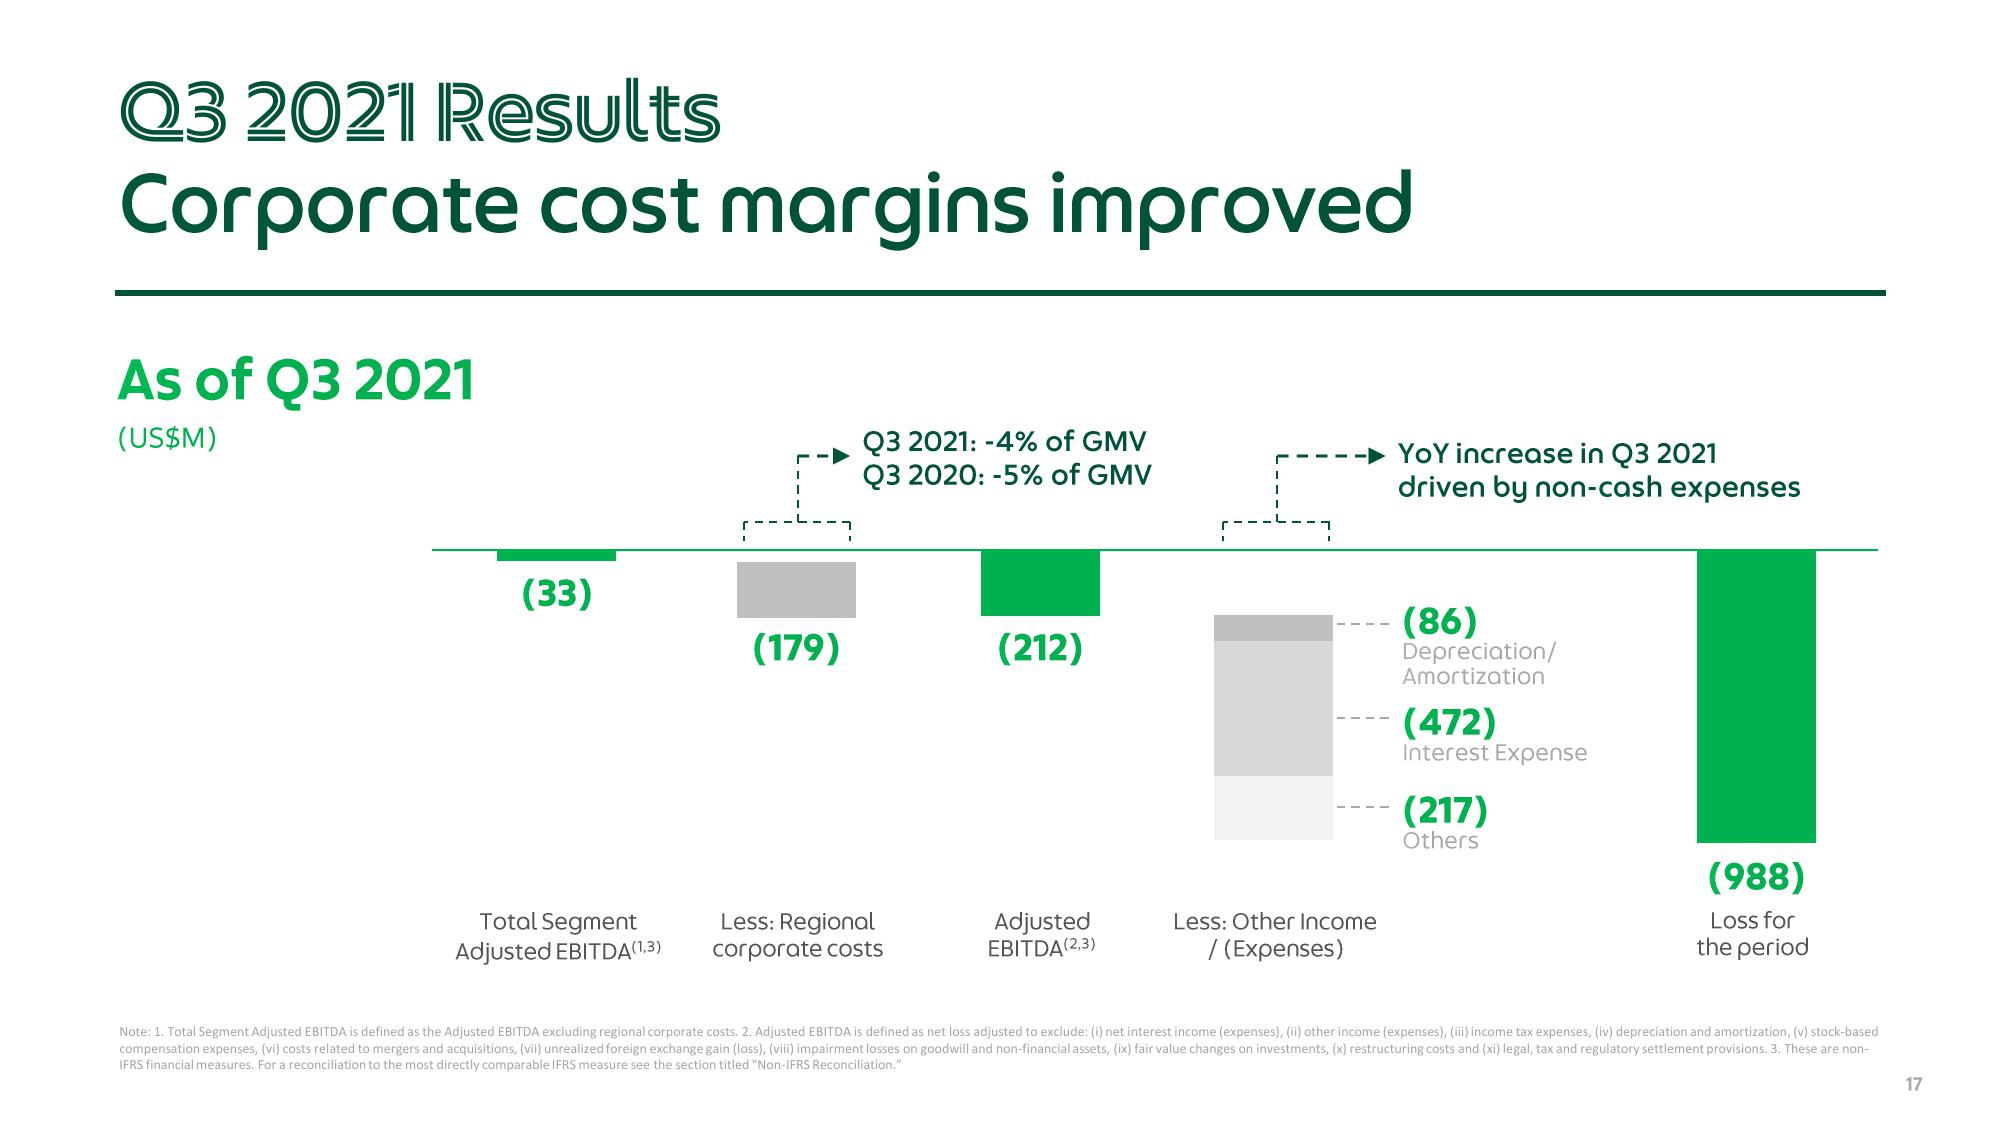
Corporate cost margins improved
As of Q3 2021
(US$M)
(33)
Total Segment
Adjusted EBITDA(1,3)
(179)
Q3 2021: -4% of GMV
Q3 2020: -5% of GMV
Less: Regional
corporate costs
(212)
Adjusted
EBITDA(2,3)
Less: Other Income
/ (Expenses)
YoY increase in Q3 2021
driven by non-cash expenses
(86)
Depreciation/
Amortization
(472)
Interest Expense
(217)
Others
(988)
Loss for
the period
Note: 1. Total Segment Adjusted EBITDA is defined as the Adjusted EBITDA excluding regional corporate costs. 2. Adjusted EBITDA is defined as net loss adjusted to exclude: (i) net interest income (expenses), (ii) other income (expenses), (iii) income tax expenses, (iv) depreciation and amortization, (v) stock-based
compensation expenses, (vi) costs related to mergers and acquisitions, (vii) unrealized foreign exchange gain (loss), (viii) impairment losses on goodwill and non-financial assets, (ix) fair value changes on investments, (x) restructuring costs and (xi) legal, tax and regulatory settlement provisions. 3. These are non-
IFRS financial measures. For a reconciliation to the most directly comparable IFRS measure see the section titled "Non-IFRS Reconciliation."
17View entire presentation