Hydrafacial Investor Presentation Deck
NET SALES
($ IN MILLIONS)
$48
'16A
$16
33%
'16A-'19A CAGR: 52%
ADJUSTED EBITDA
($ IN MILLIONS)
'16A
$66
'17A
$17
'16A-'19A CAGR: 33%
26%
$112
'17A
'18A
$26
23%
'18A
GROWTH PROFILE
$167
'19A
$37
22%
'19A
$119
¹20A
$8
7%
'20A
$200
'21E
13%
¹21E
●
●
●
●
KEY TAKEAWAYS
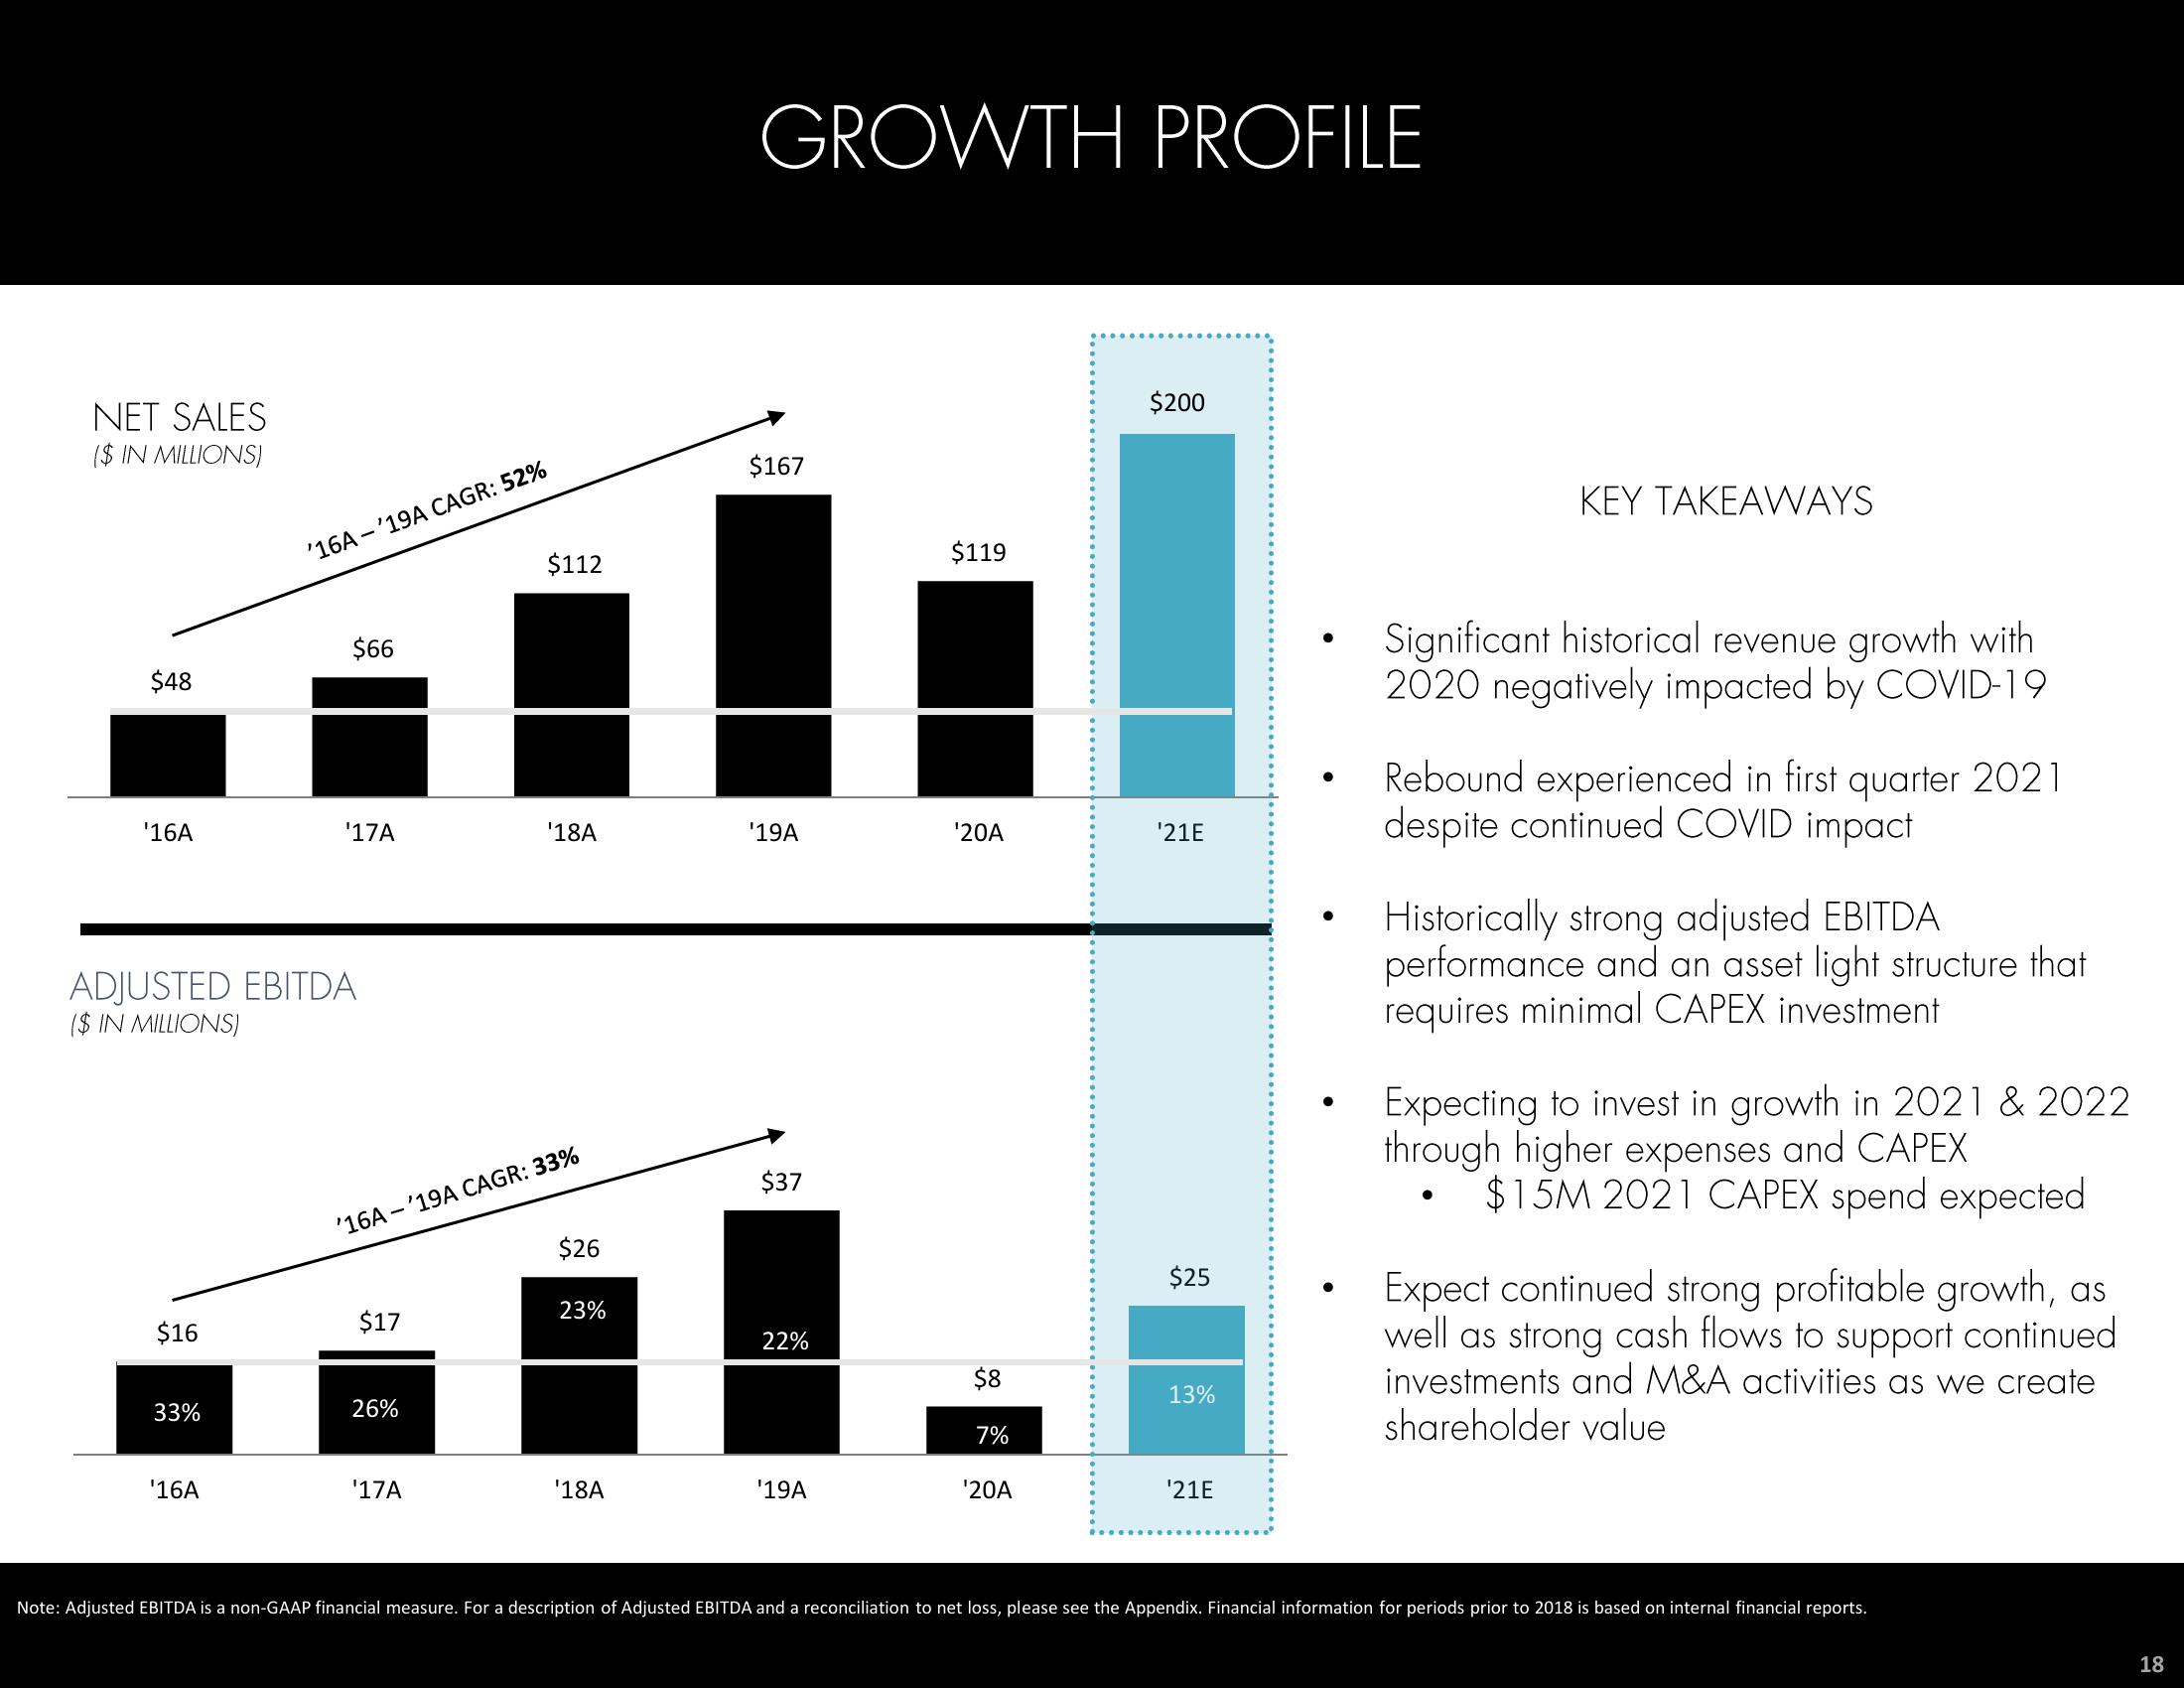
Significant historical revenue growth with
2020 negatively impacted by COVID-19
Rebound experienced in first quarter 2021
despite continued COVID impact
Historically strong adjusted EBITDA
performance and an asset light structure that
requires minimal CAPEX investment
Expecting to invest in growth in 2021 & 2022
through higher expenses and CAPEX
$15M 2021 CAPEX spend expected
Expect continued strong profitable growth, as
well as strong cash flows to support continued
investments and M&A activities as we create
shareholder value
Note: Adjusted EBITDA is a non-GAAP financial measure. For a description of Adjusted EBITDA and a reconciliation to net loss, please see the Appendix. Financial information for periods prior to 2018 is based on internal financial reports.
18View entire presentation