BlackRock Results Presentation Deck
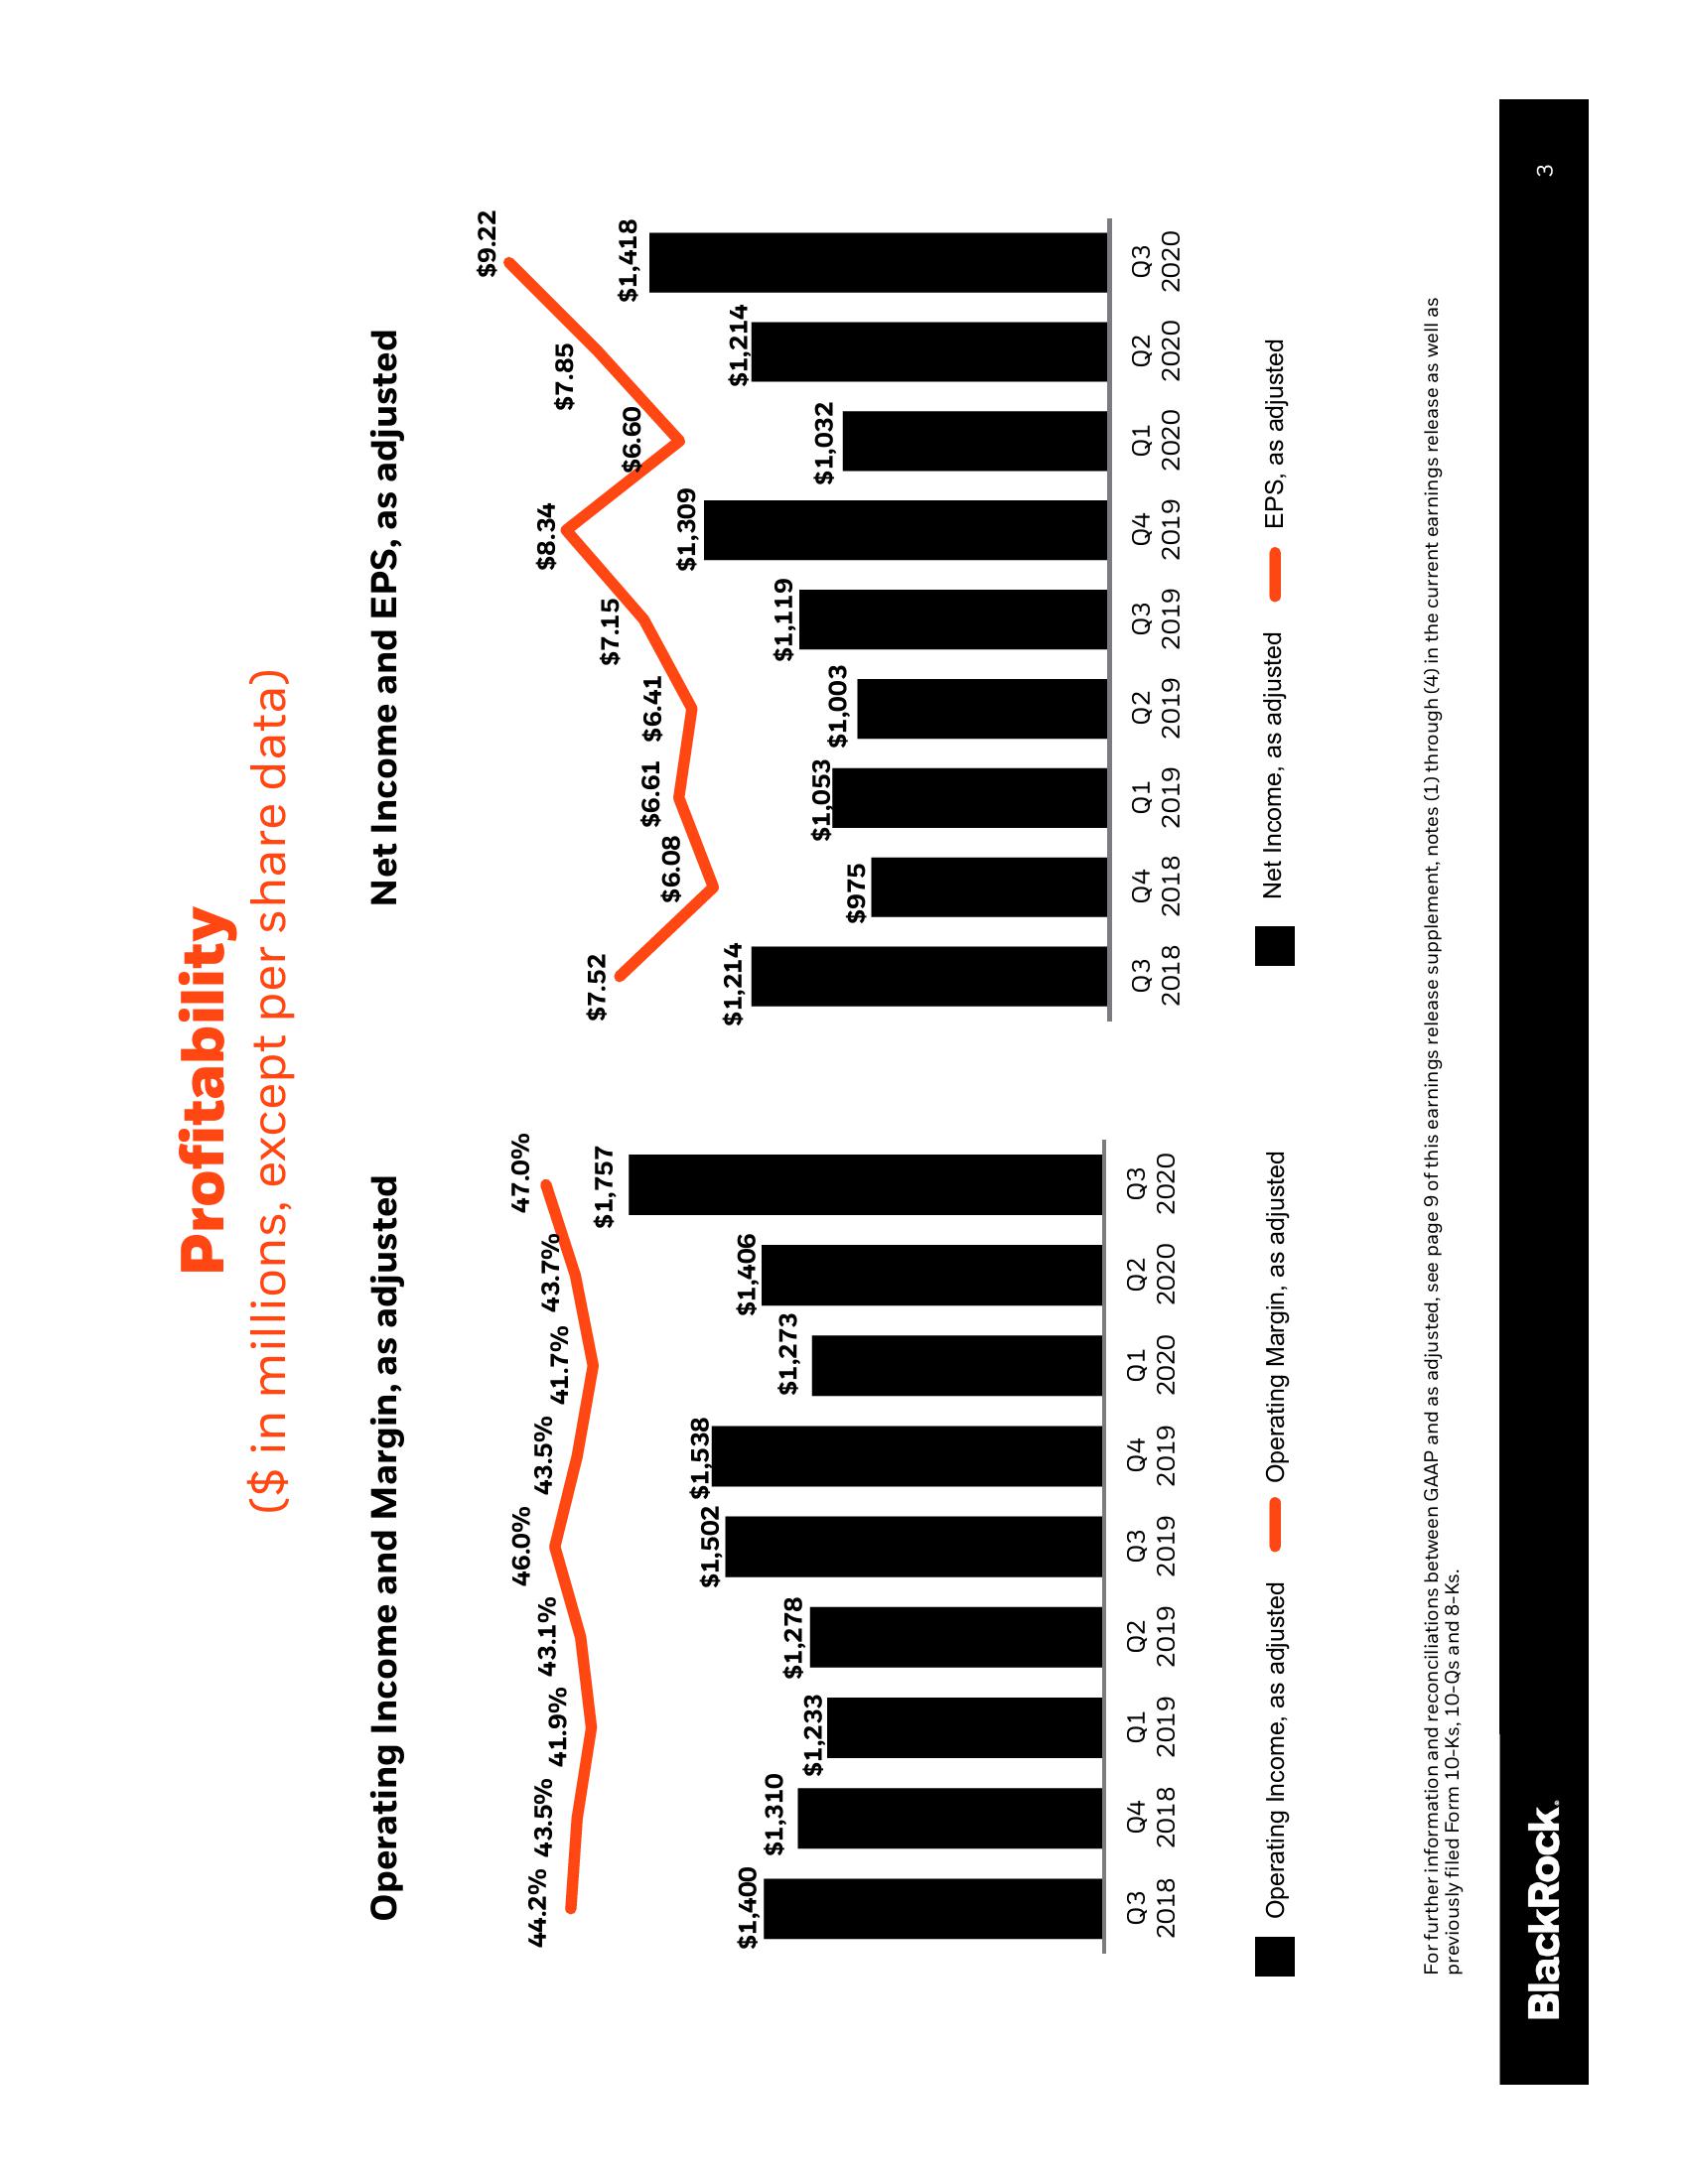
Operating Income and Margin, as adjusted
44.2% 43.5%
$1,400
$1,310
Q3 Q4
2018
41.9%
$1,233
43.1%
BlackRock.
$1,278
Q1 Q2 Q3
2018 2019 2019 2019
Profitability
($ in millions, except per share data)
46.0%
Operating Income, as adjusted
$1,502 $1,538
43.5%
43.7%
41.7%
$1,406
$1,273
47.0%
$1,757
Q4 Q1 Q2 Q3
2019 2020 2020 2020
Operating Margin, as adjusted
$7.52
$1,214
Q3
2018
Net Income and EPS, as adjusted
$6.08
$975
$6.61 $6.41
$1,053
$7.15
$1,003
$1,119
$8.34
Net Income, as adjusted
$1,309
$7.85
$6.60
$1,032
$1,214
Q4 Q1 Q2 Q3 Q4 Q1 Q2 Q3
2018 2019 2019 2019 2019 2020 2020 2020
EPS, as adjusted
$9.22
$1,418
For further information and reconciliations between GAAP and as adjusted, see page 9 of this earnings release supplement, notes (1) through (4) in the current earnings release as well as
previously filed Form 10-Ks, 10-Qs and 8-Ks.
3View entire presentation