Grab Results Presentation Deck
Outlook
Outlook for 2023
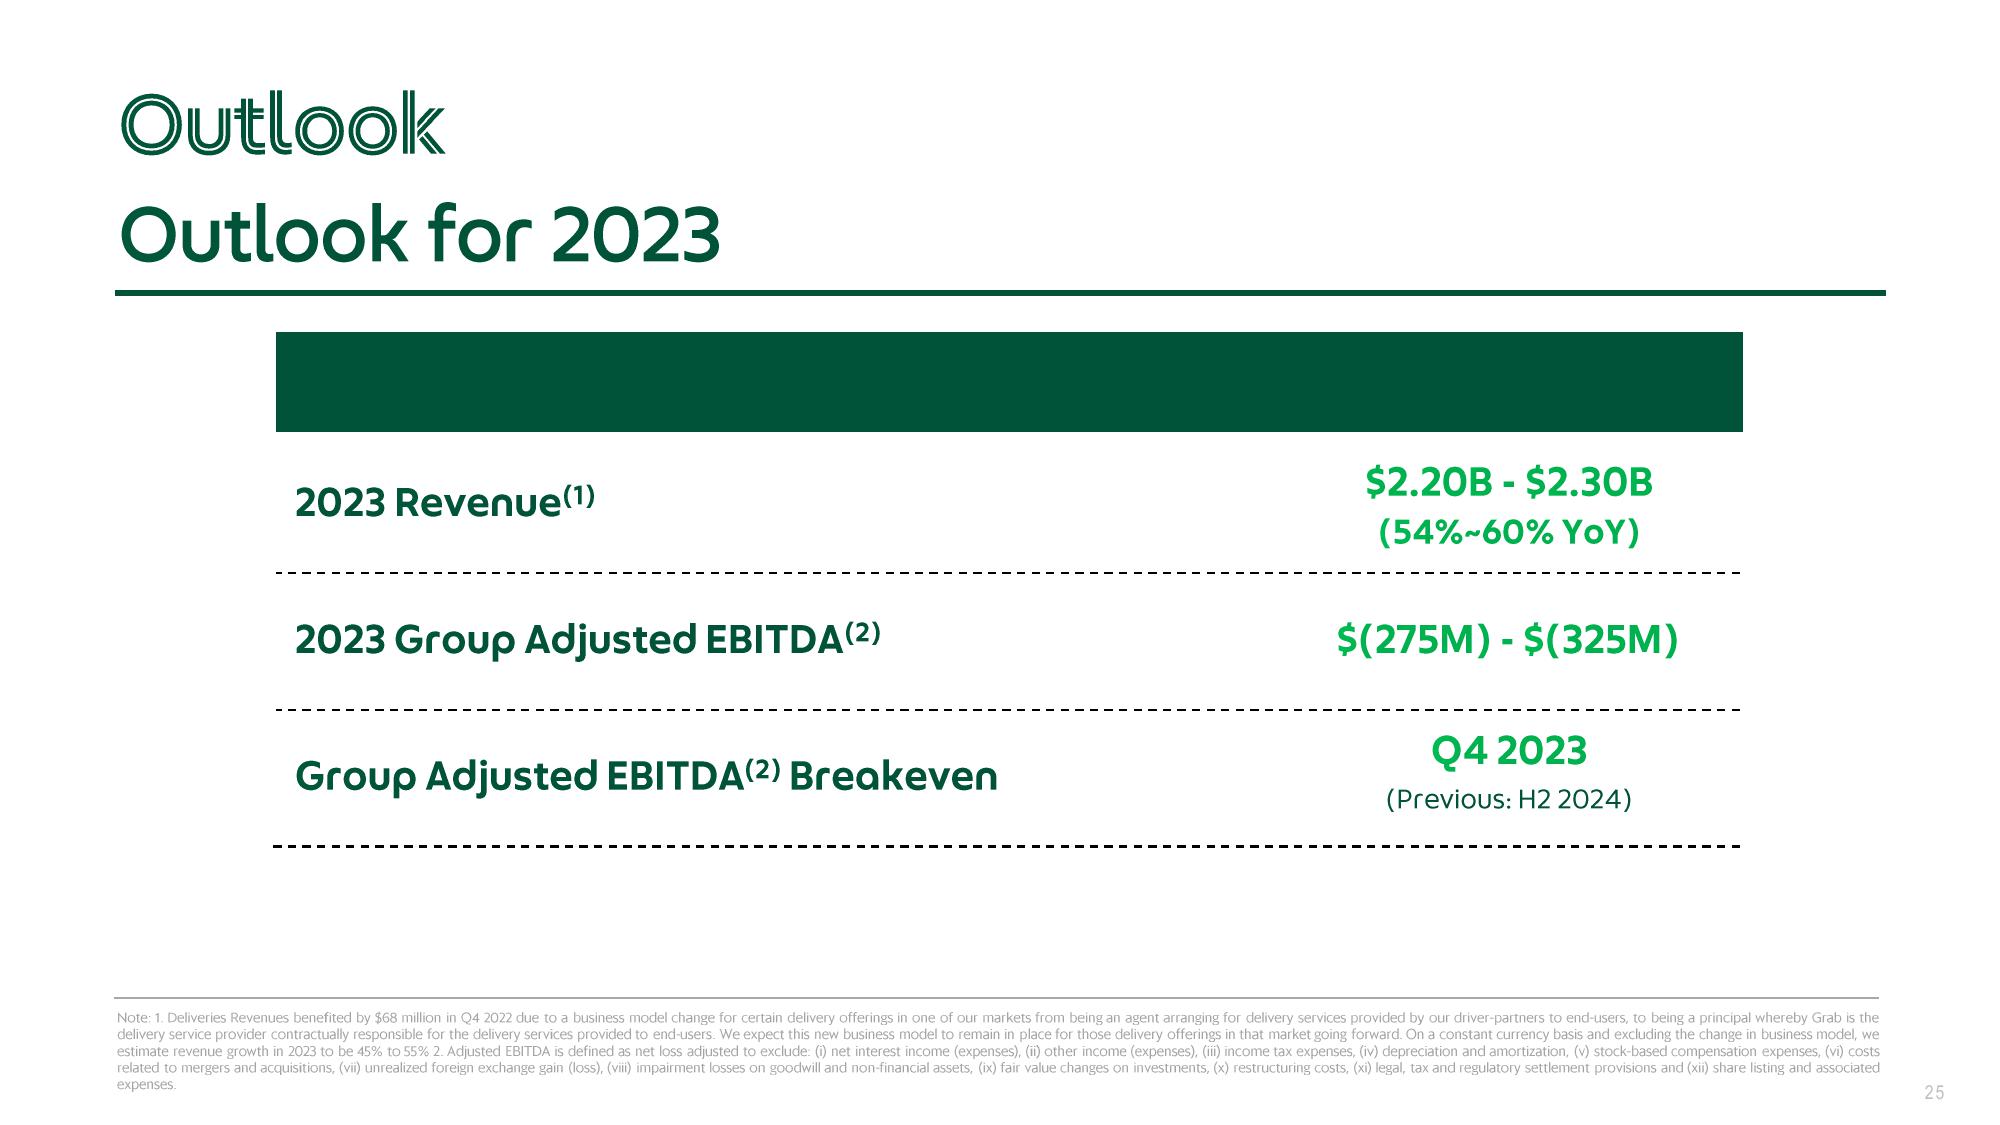
2023 Revenue (1)
2023 Group Adjusted EBITDA (2)
Group Adjusted EBITDA (2) Breakeven
$2.20B-$2.30B
(54%-60% YoY)
$(275M) - $(325M)
Q4 2023
(Previous: H2 2024)
Note: 1. Deliveries Revenues benefited by $68 million in Q4 2022 due to a business model change for certain delivery offerings in one of our markets from being an agent arranging for delivery services provided by our driver-partners to end-users, to being a principal whereby Grab is the
delivery service provider contractually responsible for the delivery services provided to end-users. We expect this new business model to remain in place for those delivery offerings in that market going forward. On a constant currency basis and excluding the change in business model, we
estimate revenue growth in 2023 to be 45% to 55% 2. Adjusted EBITDA is defined as net loss adjusted to exclude: (i) net interest income (expenses), (ii) other income (expenses), (iii) income tax expenses, (iv) depreciation and amortization, (v) stock-based compensation expenses, (vi) costs
related to mergers and acquisitions, (vii) unrealized foreign exchange gain (loss), (viii) impairment losses on goodwill and non-financial assets, (ix) fair value changes on investments, (x) restructuring costs, (xi) legal, tax and regulatory settlement provisions and (xii) share listing and associated
expenses.
25View entire presentation