Bausch+Lomb Results Presentation Deck
Raising Full-Year 2023 Revenue and
Maintaining Adjusted EBITDA (non-GAAP)1 Guidance³
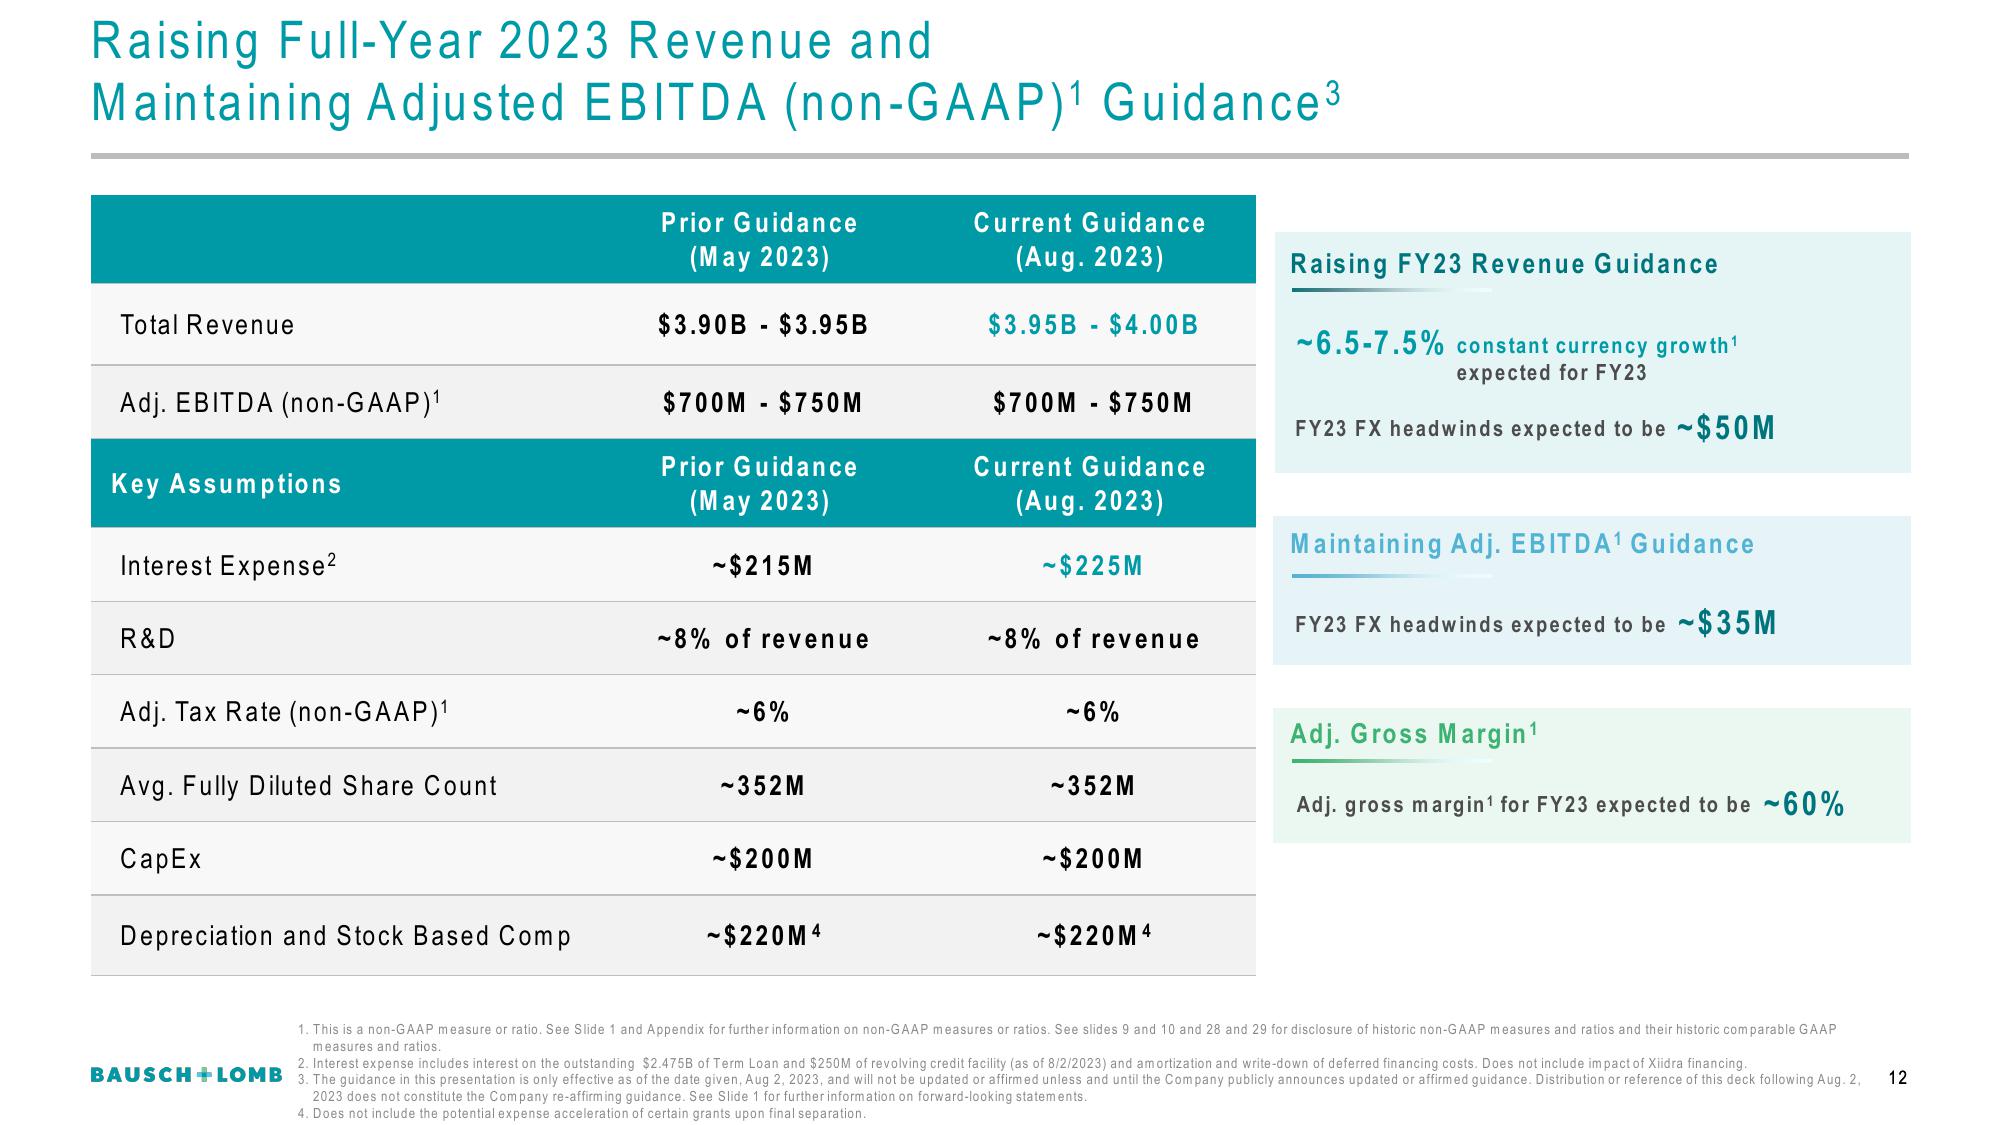
Total Revenue
Adj. EBITDA (non-GAAP)¹
Key Assumptions
Interest Expense²
R&D
Adj. Tax Rate (non-GAAP)¹
Avg. Fully Diluted Share Count
CapEx
Depreciation and Stock Based Comp
Prior Guidance
(May 2023)
$3.90B $3.95B
$700M $750M
Prior Guidance
(May 2023)
-$215M
-8% of revenue
-6%
-352M
-$200M
-$220M4
Current Guidance
(Aug. 2023)
$3.95B $4.00B
$700M $750M
Current Guidance
(Aug. 2023)
-$225M
-8% of revenue
-6%
-352M
-$200M
-$220M4
Raising FY23 Revenue Guidance
-6.5-7.5% constant currency growth¹
expected for FY23
FY23 FX headwinds expected to be ~$50M
Maintaining Adj. EBITDA¹ Guidance
FY23 FX headwinds expected to be ~$35M
Adj. Gross Margin ¹
Adj. gross margin¹ for FY23 expected to be 60%
1. This is a non-GAAP measure or ratio. See Slide 1 and Appendix for further information on non-GAAP measures or ratios. See slides 9 and 10 and 28 and 29 for disclosure of historic non-GAAP measures and ratios and their historic comparable GAAP
measures and ratios.
2. Interest expense includes interest on the outstanding $2.475B of Term Loan and $250M of revolving credit facility (as of 8/2/2023) and amortization and write-down of deferred financing costs. Does not include impact of Xiidra financing.
BAUSCH+LOMB 3. The guidance in this presentation is only effective as of the date given, Aug 2, 2023, and will not be updated or affirmed unless and until the Company publicly announces updated or affirmed guidance. Distribution or reference of this deck following Aug. 2,
2023 does not constitute the Company re-affirming guidance. See Slide 1 for further information on forward-looking statements.
4. Does not include the potential expense acceleration of certain grants upon final separation.
12View entire presentation