NVIDIA Investor Presentation Deck
Q2
FY24
Gross margin
($ in million)
Operating income
($ in million)
Net income
($ in million)
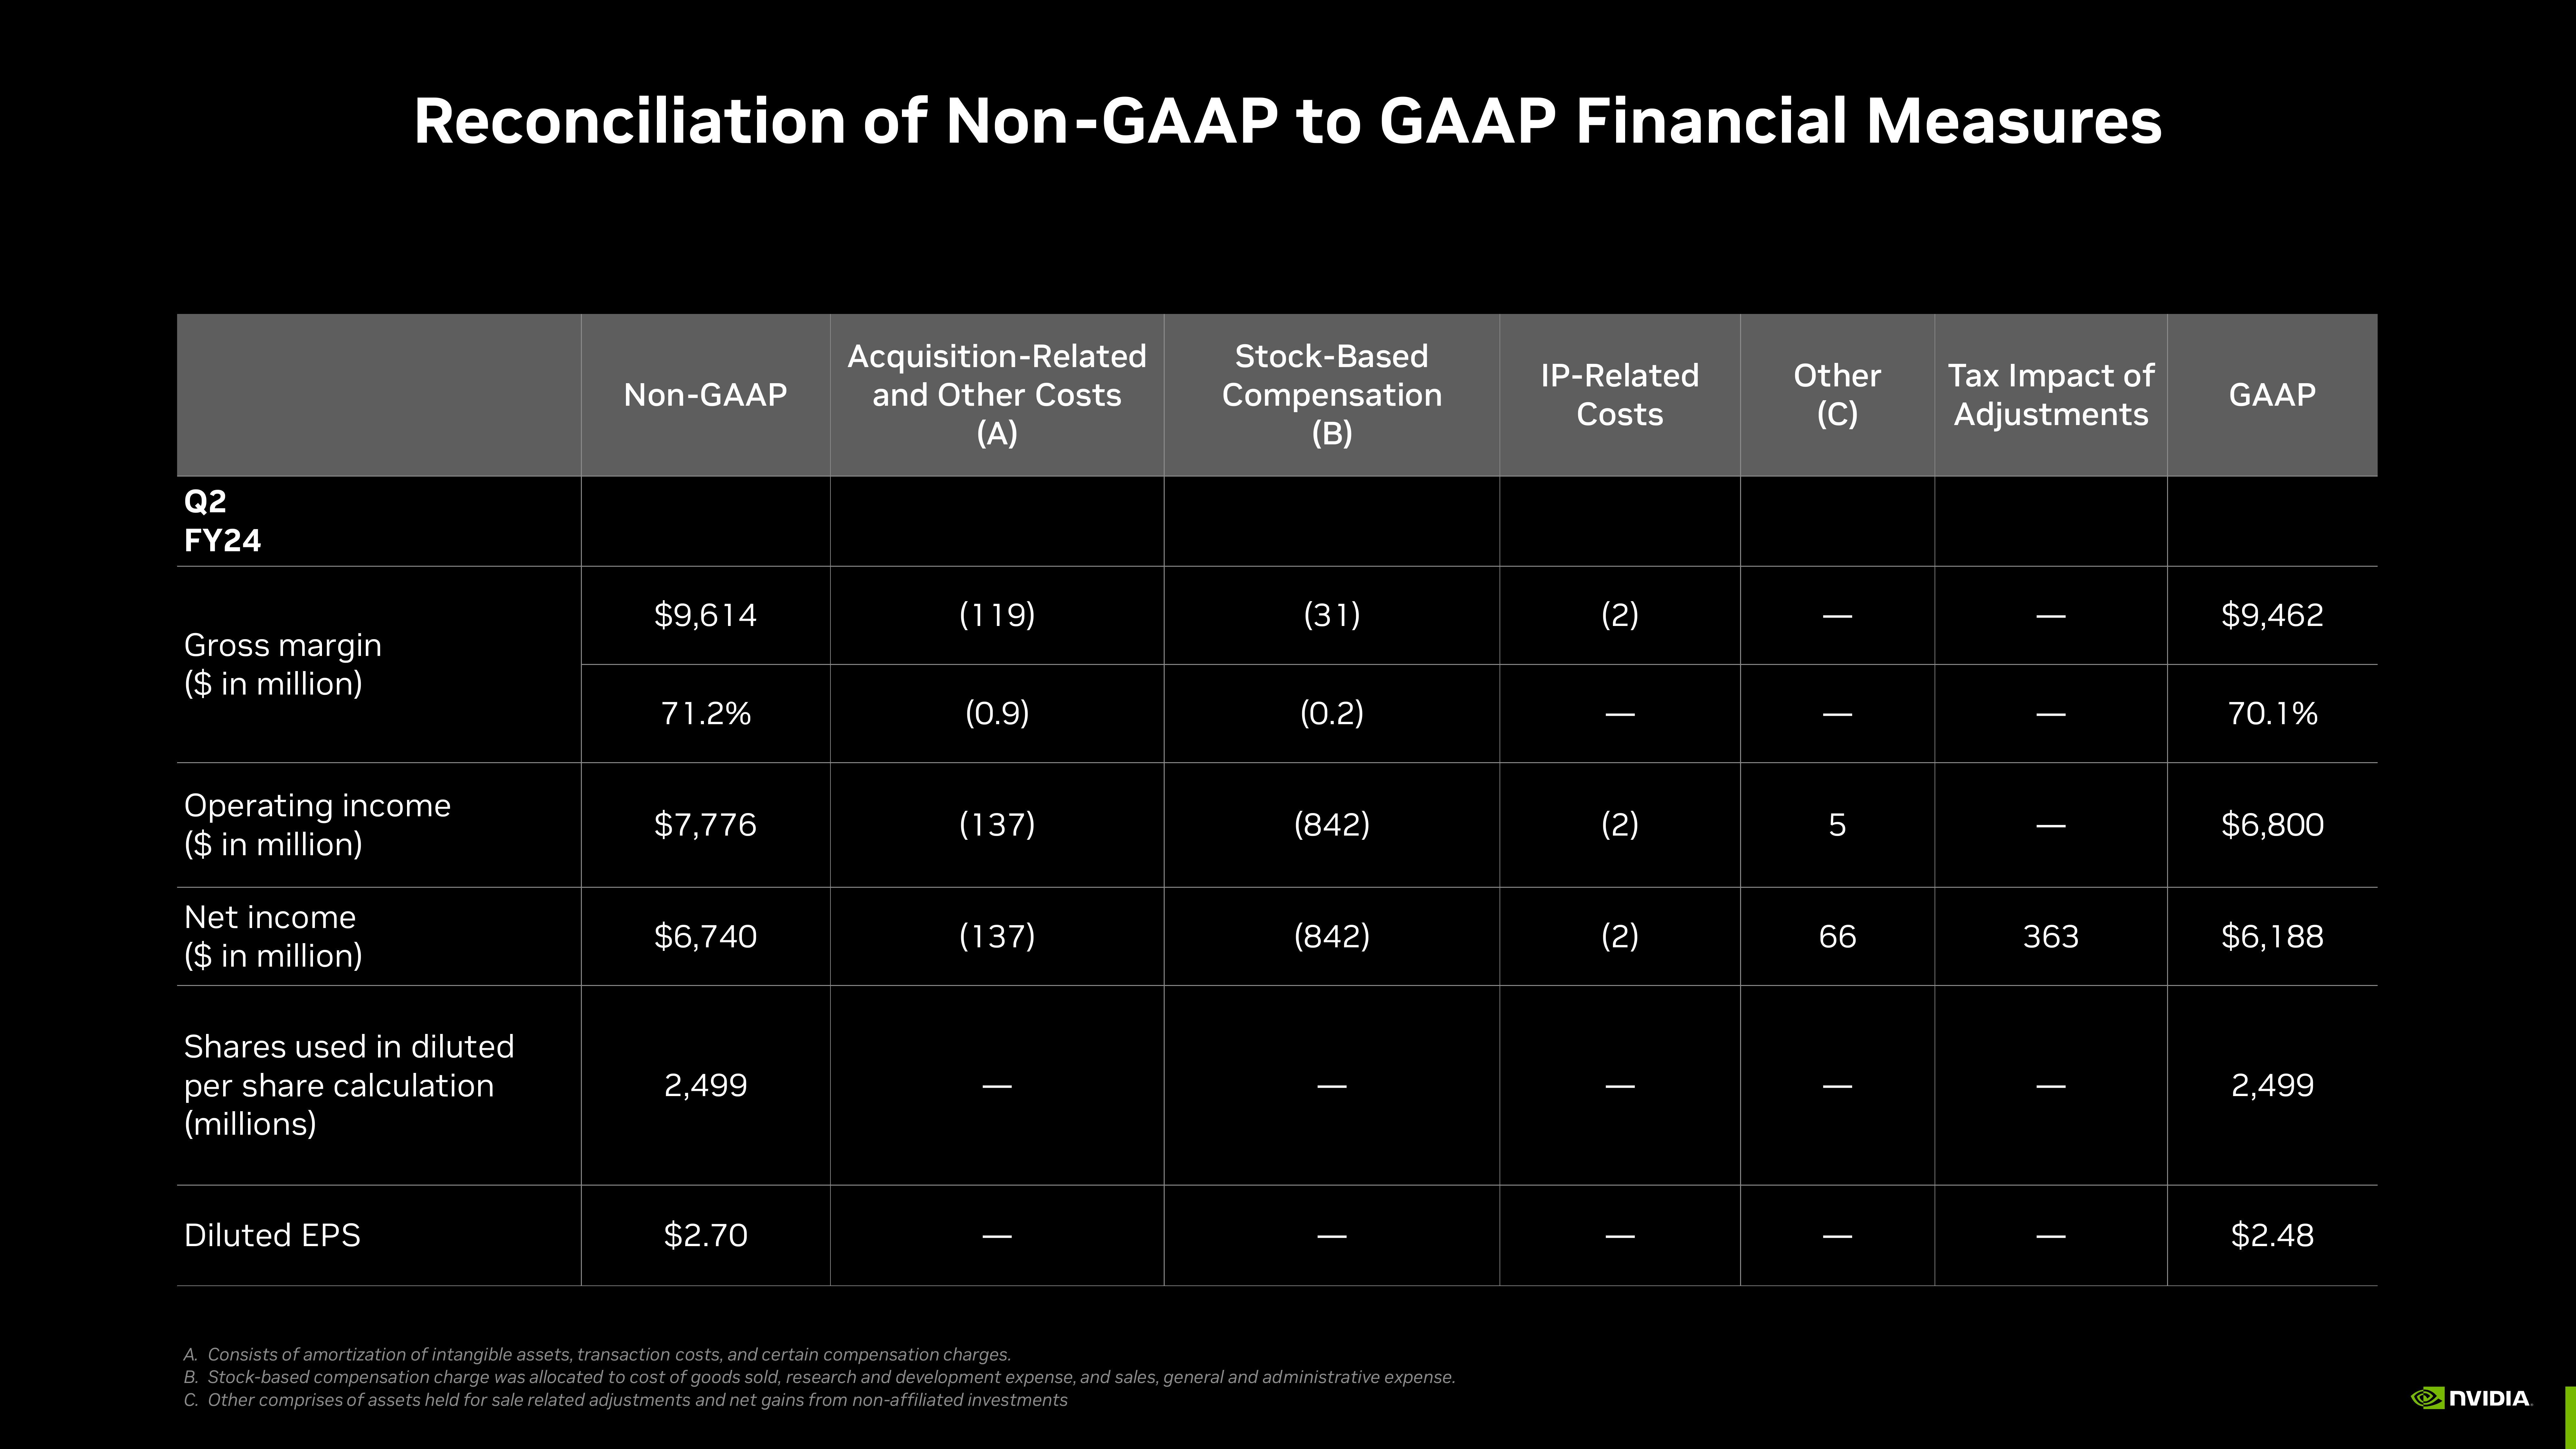
Reconciliation of Non-GAAP to GAAP Financial Measures
Shares used in diluted
per share calculation
(millions)
Diluted EPS
Non-GAAP
$9,614
71.2%
$7,776
$6,740
2,499
$2.70
Acquisition-Related
and Other Costs
(A)
(119)
(0.9)
(137)
(137)
I
Stock-Based
Compensation
(B)
(31)
(0.2)
(842)
(842)
|
|
A. Consists of amortization of intangible assets, transaction costs, and certain compensation charges.
B. Stock-based compensation charge was allocated to cost of goods sold, research and development expense, and sales, general and administrative expense.
C. Other comprises of assets held for sale related adjustments and net gains from non-affiliated investments
IP-Related
Costs
(2)
|
(2)
(2)
I
.
Other
(C)
I
—
5
66
|
T
Tax Impact of
Adjustments
|
|
I
363
|
T
GAAP
$9,462
70.1%
$6,800
$6,188
2,499
$2.48
NVIDIAView entire presentation