Melrose Results Presentation Deck
Summary of results
Melrose
Continuing operations
Revenue
Operating profit/(loss)
Profit/(loss) after tax
Diluted earnings per share
Free cash flow²
Net debt²
Leverage ²
■
I
Proforma¹
(post Return
of Capital)
Buy
Improve
Sell
2021
£m
3,828
223
109
2.5p
75
1,029
1.5x
Adjusted ² results
2021
£m
3,828
223
109
2.2p
75
300
0.5x
2020
£m
3,624
(11)
(80)
(1.7)p
29
3,399
3.4x
Statutory results
2021
£m
3,540
(137)
(151)
(3.1) p
n/a
n/a
n/a
2020
£m
3,386
(618)
(585)
(12.1)p
n/a
n/a
n/a
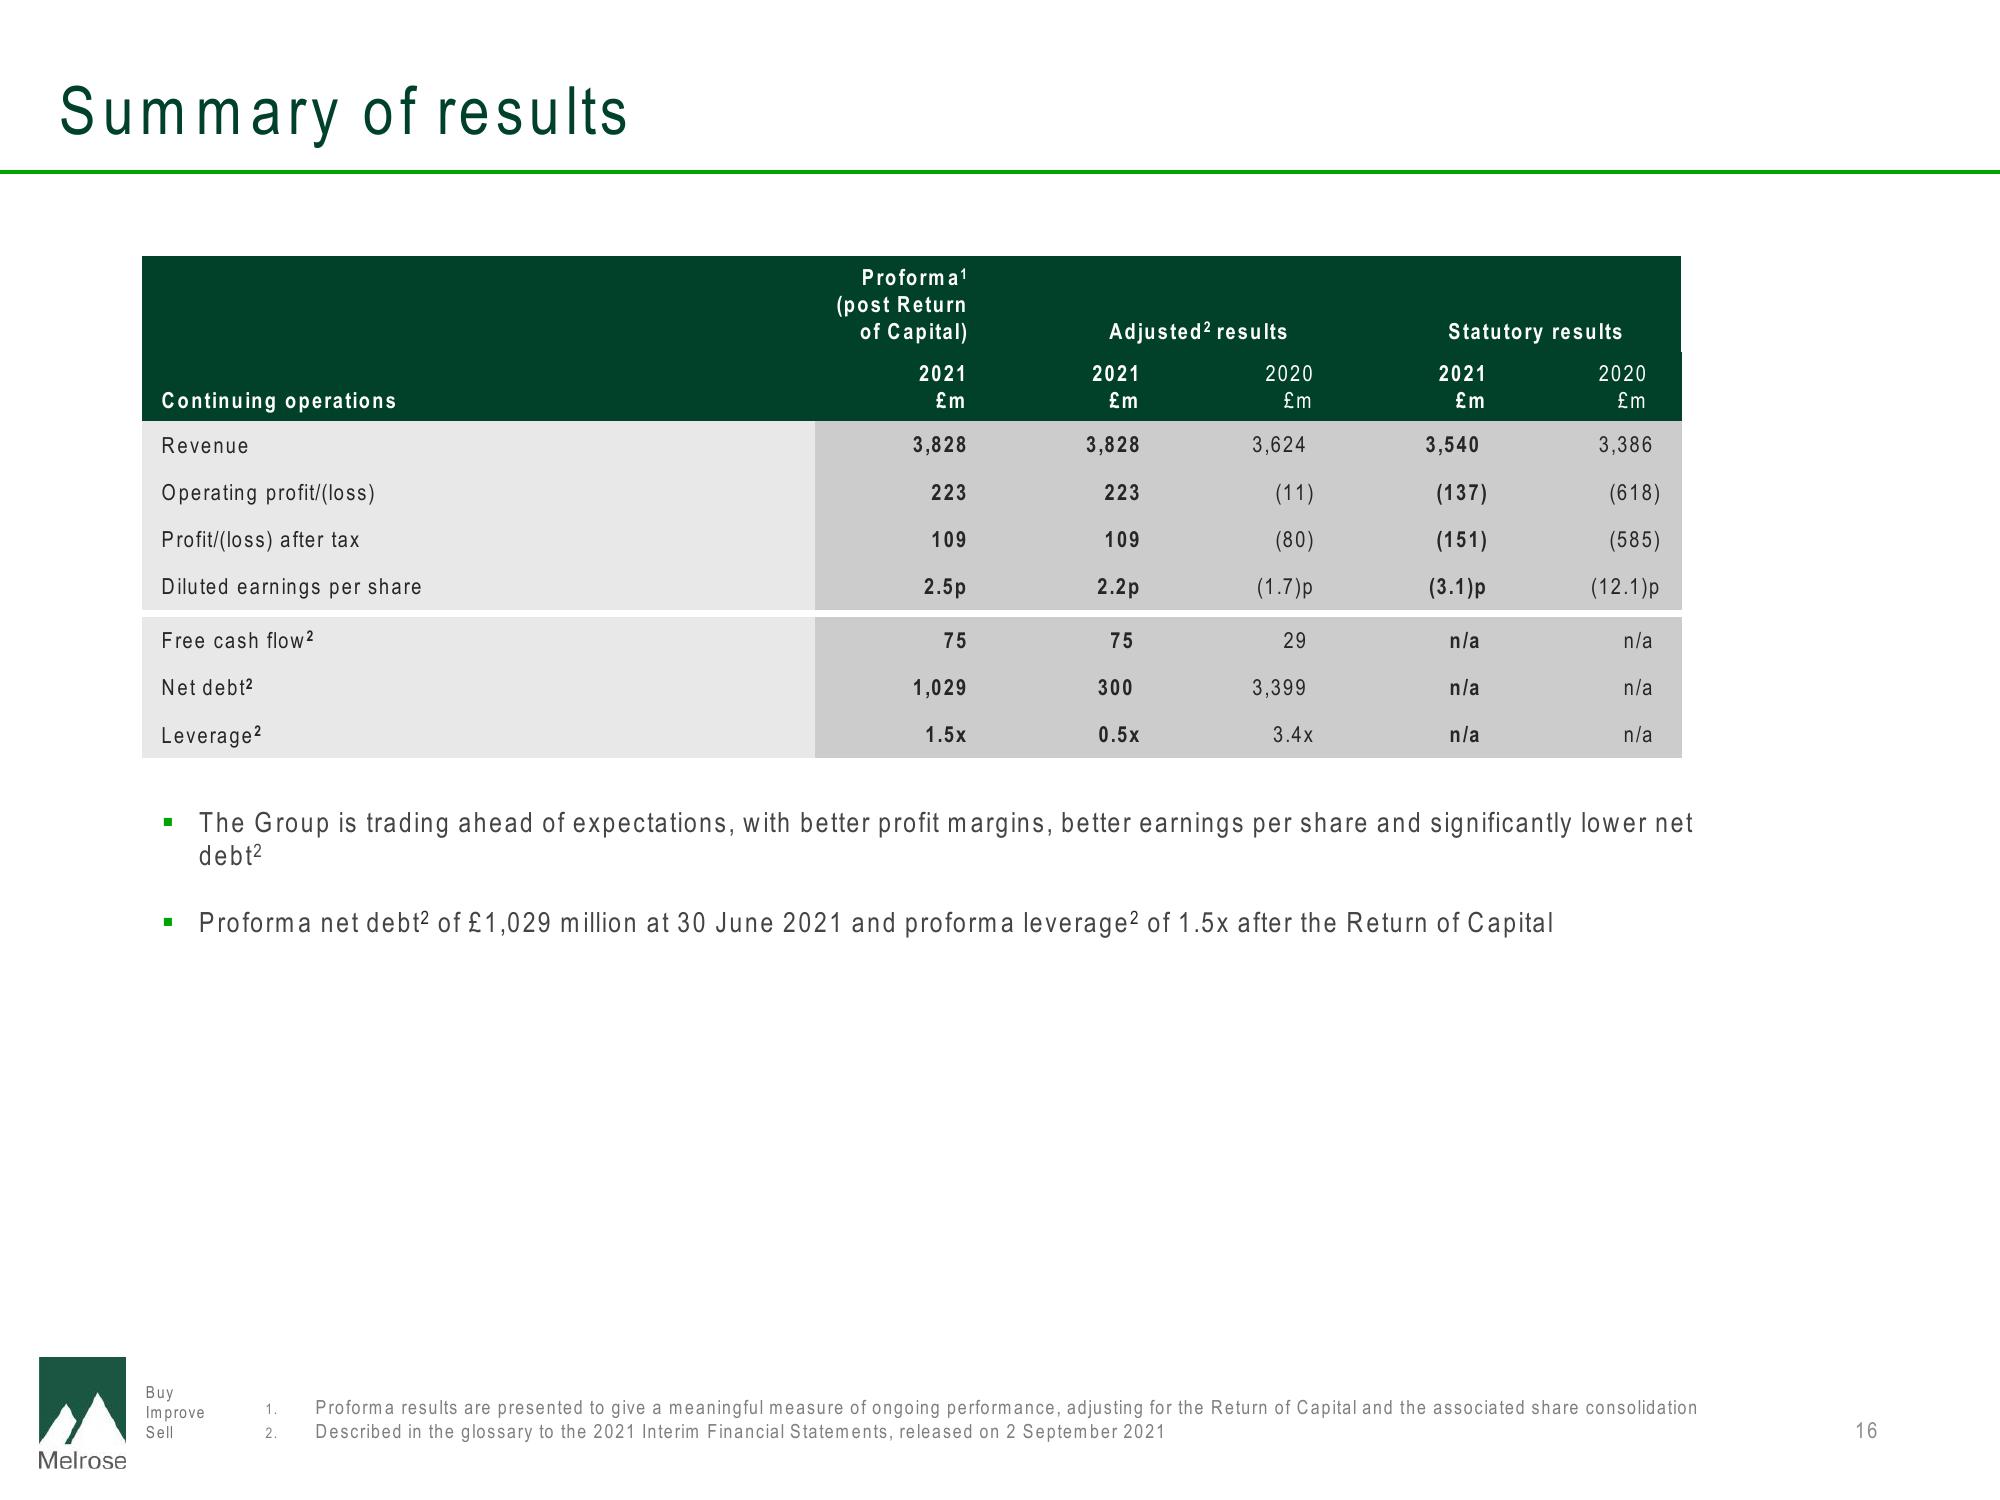
The Group is trading ahead of expectations, with better profit margins, better earnings per share and significantly lower net
debt²
Proforma net debt² of £1,029 million at 30 June 2021 and proforma leverage2 of 1.5x after the Return of Capital
1.
Proforma results are presented to give a meaningful measure of ongoing performance, adjusting for the Return of Capital and the associated share consolidation
2. Described in the glossary to the 2021 Interim Financial Statements, released on 2 September 2021
16View entire presentation