Despegar Results Presentation Deck
Cost Discipline Builds Additional Operating Leverage as Revenues Expand
1 G&A + T&PD ($M)
48.4
21.4
27.0
2Q22
47.7
22.8
24.9
3022
51.1
25.0
26.1
4Q22
G&A=T&PD
48.6
26.0
22.7
1Q23
49.1
26.4
14.3
8.4
2Q23
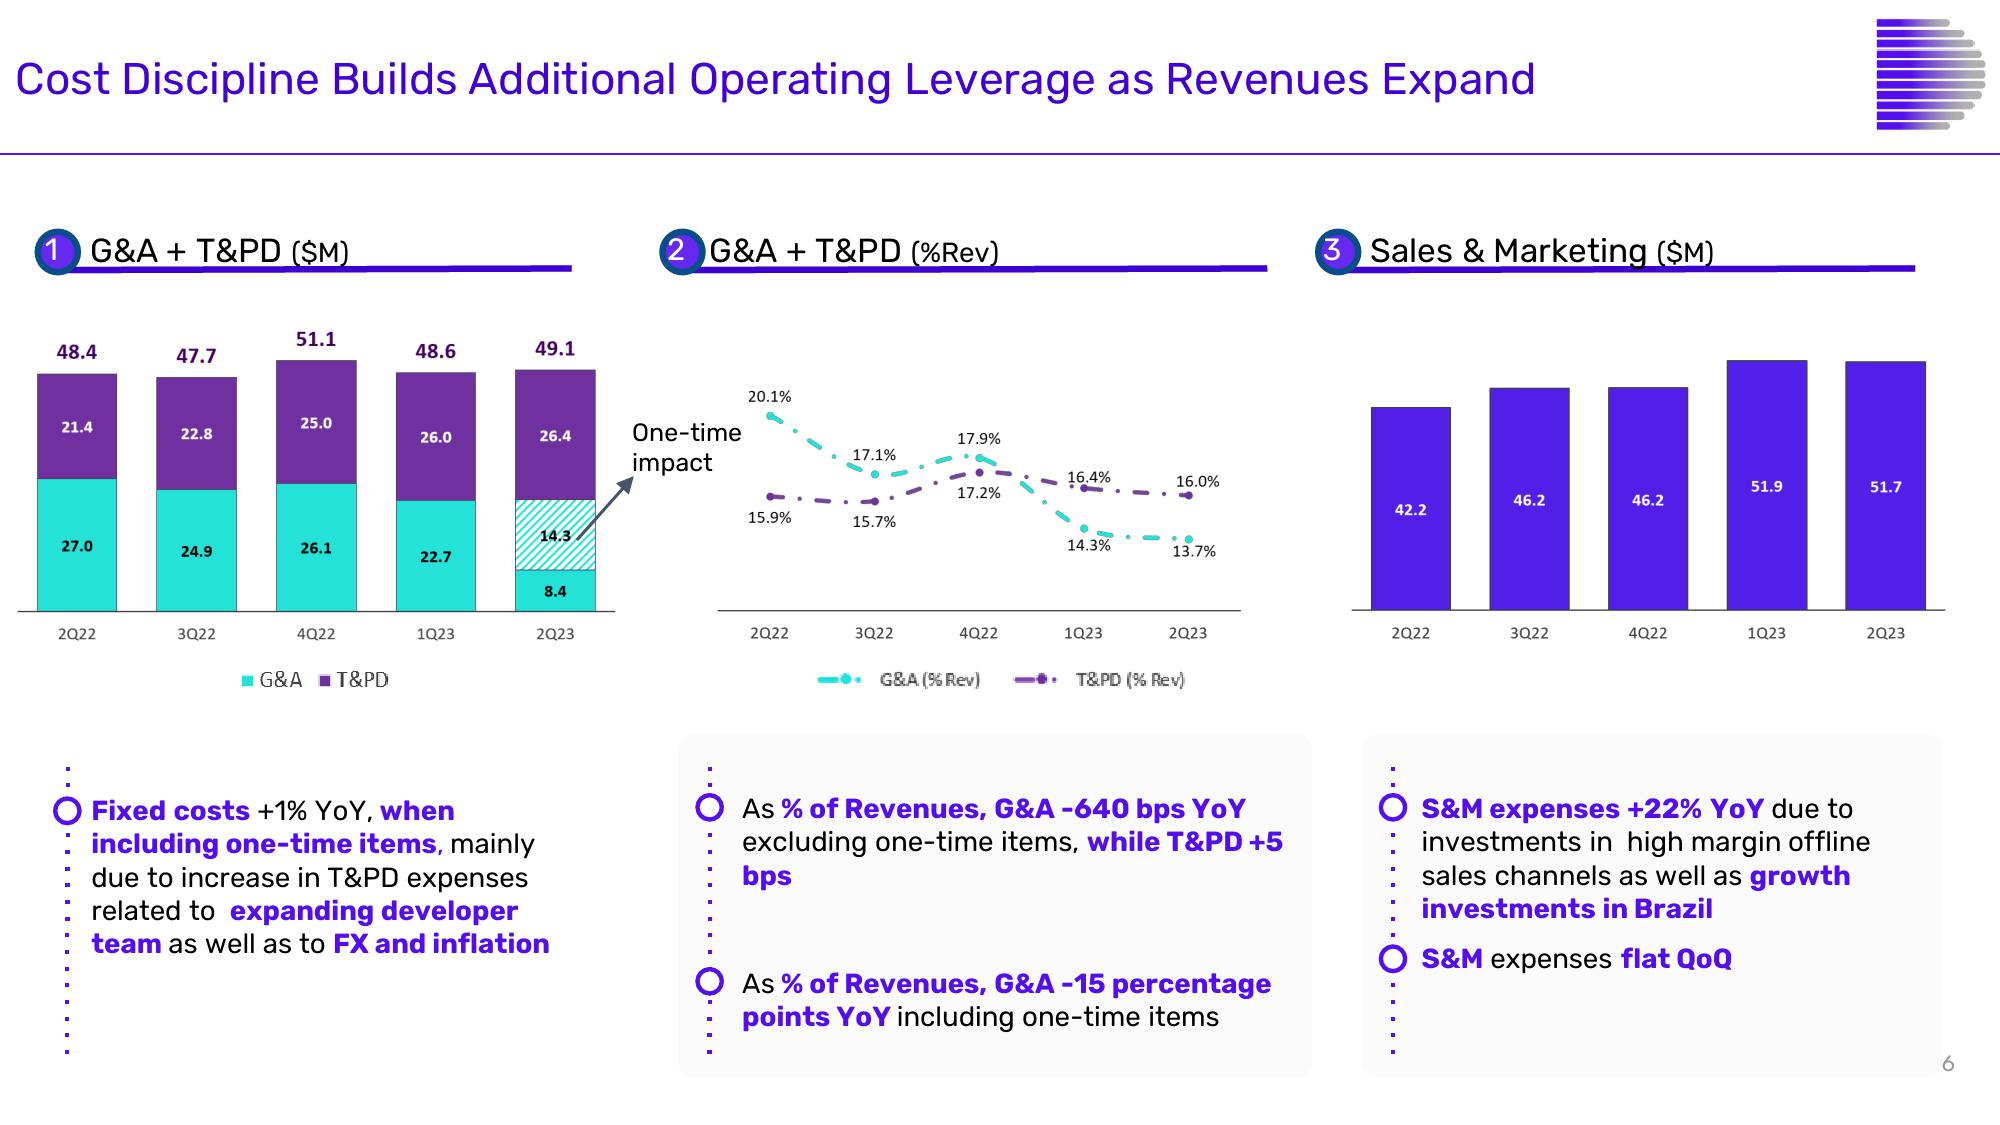
Fixed costs +1% YoY, when
including one-time items, mainly
due to increase in T&PD expenses
related to expanding developer
team as well as to FX and inflation
2 G&A + T&PD (%Rev)
One-time
impact
20.1%
15.9%
2Q22
17.1%
15.7%
3Q22
17.9%
17.2%
4Q22
- G&A (% Rev)
16.4%
●
14.3%
1Q23
16.0%
13.7%
2023
T&PD (% Rev)
As % of Revenues, G&A -640 bps YoY
excluding one-time items, while T&PD +5
bps
As % of Revenues, G&A -15 percentage
points YoY including one-time items
3 Sales & Marketing ($M)
42.2
2Q22
46.2
3Q22
46.2
4Q22
51.9
1Q23
51.7
2Q23
S&M expenses +22% YoY due to
investments in high margin offline
sales channels as well as growth
investments in Brazil
O S&M expenses flat QoQ
6View entire presentation