GlobalFoundries Results Presentation Deck
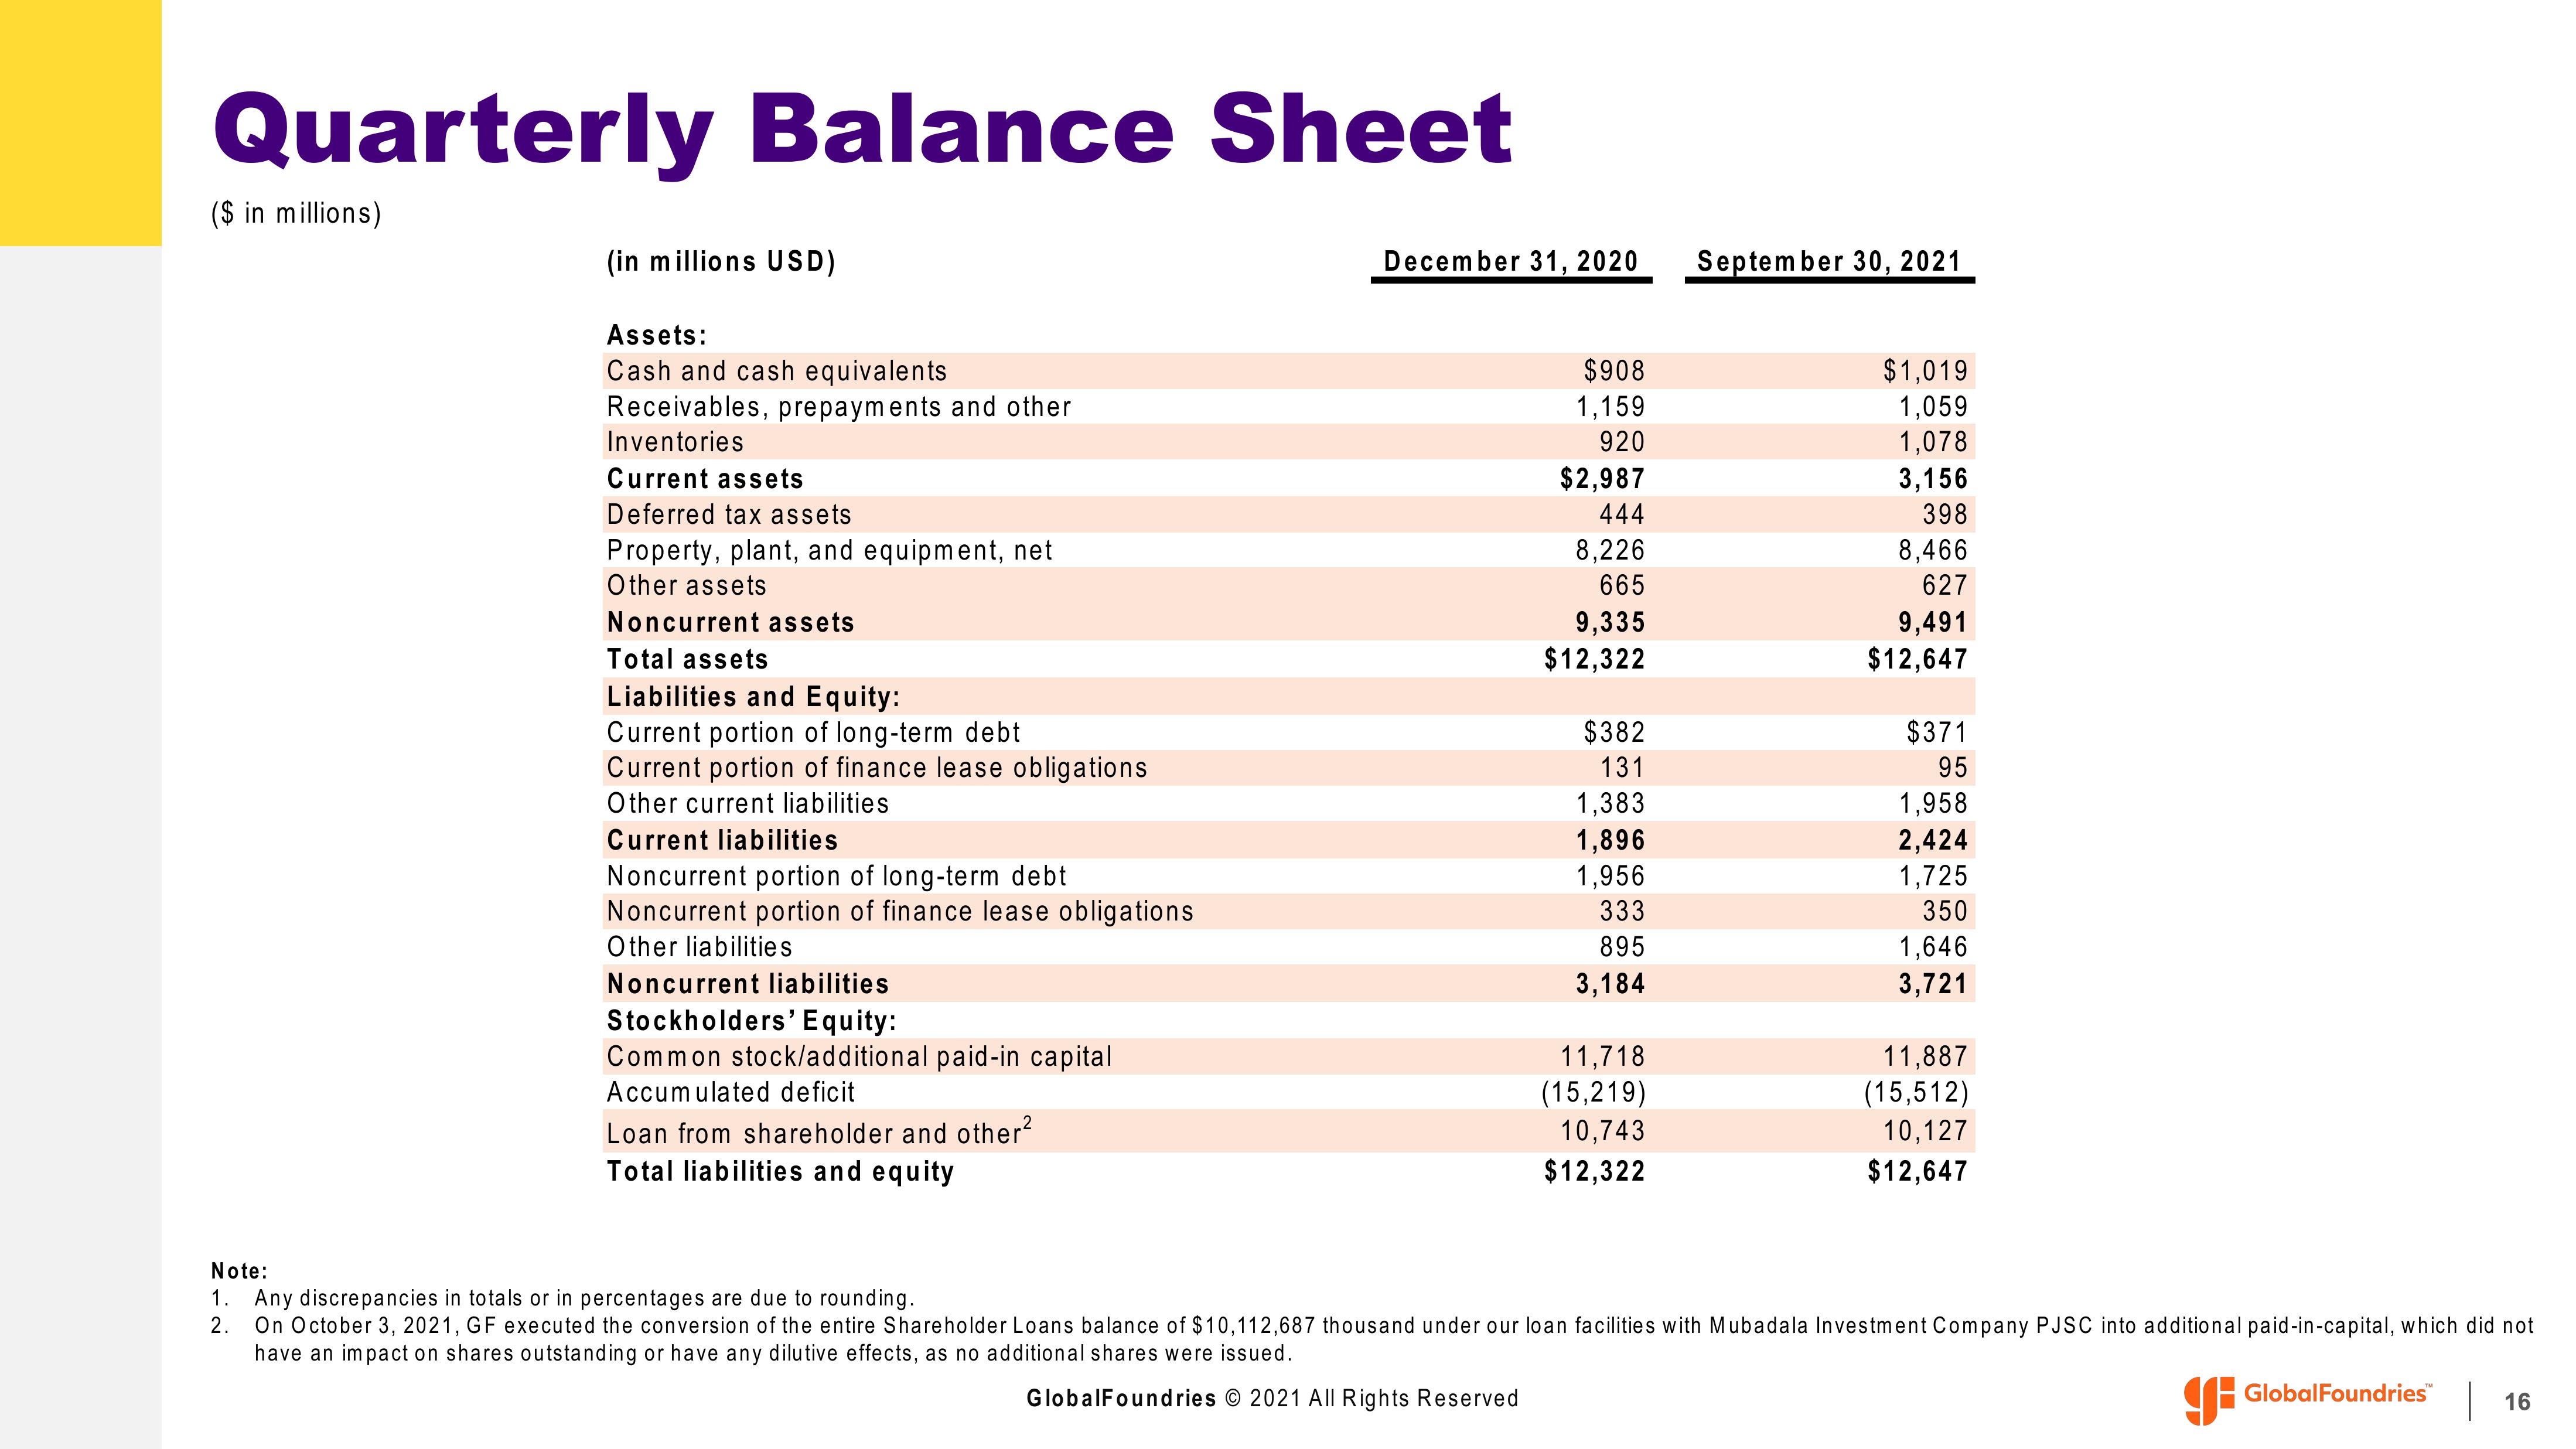
Quarterly Balance Sheet
($ in millions)
(in millions USD)
Assets:
Cash and cash equivalents
Receivables, prepayments and other
Inventories
Current assets
Deferred tax assets
Property, plant, and equipment, net
Other assets
Noncurrent assets
Total assets
Liabilities and Equity:
Current portion of long-term debt
Current portion of finance lease obligations
Other current liabilities
Current liabilities
Noncurrent portion of long-term debt
Noncurrent portion of finance lease obligations
Other liabilities
Noncurrent liabilities
Stockholders' Equity:
Common stock/additional paid-in capital
Accumulated deficit
Loan from shareholder and other²
Total liabilities and equity
December 31, 2020
$908
1,159
920
$2,987
444
8,226
665
9,335
$12,322
$382
131
1,383
1,896
1,956
333
895
3,184
11,718
(15,219)
10,743
$12,322
September 30, 2021
$1,019
1,059
1,078
3,156
398
8,466
627
9,491
$12,647
$371
95
1,958
2,424
1,725
350
1,646
3,721
11,887
(15,512)
10,127
$12,647
Note:
1. Any discrepancies in totals or in percentages are due to rounding.
2. On October 3, 2021, GF executed the conversion of the entire Shareholder Loans balance of $10,112,687 thousand under our loan facilities with Mubadala Investment Company PJSC into additional paid-in-capital, which did not
have an impact on shares outstanding or have any dilutive effects, as no additional shares were issued.
GlobalFoundries © 2021 All Rights Reserved
GlobalFoundries™ 16View entire presentation