Aptiv Overview
1Q 2020 vs. 1Q 2019
($ millions, except per share amounts)
REPORTED REVENUE
Adjusted Growth %1 | Growth Over Market
EBITDA²
EBITDA Margin
OPERATING INCOME²
Operating Margin
EARNINGS PER SHARE²
OPERATING CASH FLOW
NET DEBT / EBITDA²
Debt / EBITDA²
1Q 2020
$3,226
$411
12.7%
$231
7.2%
$0.68
$161
1.9x
2.9x
Fav / (Unfav)
($349)
(7%) | 13%
($107)
(180) bps
($114)
(250) bps
($0.37)
(35%)
$77
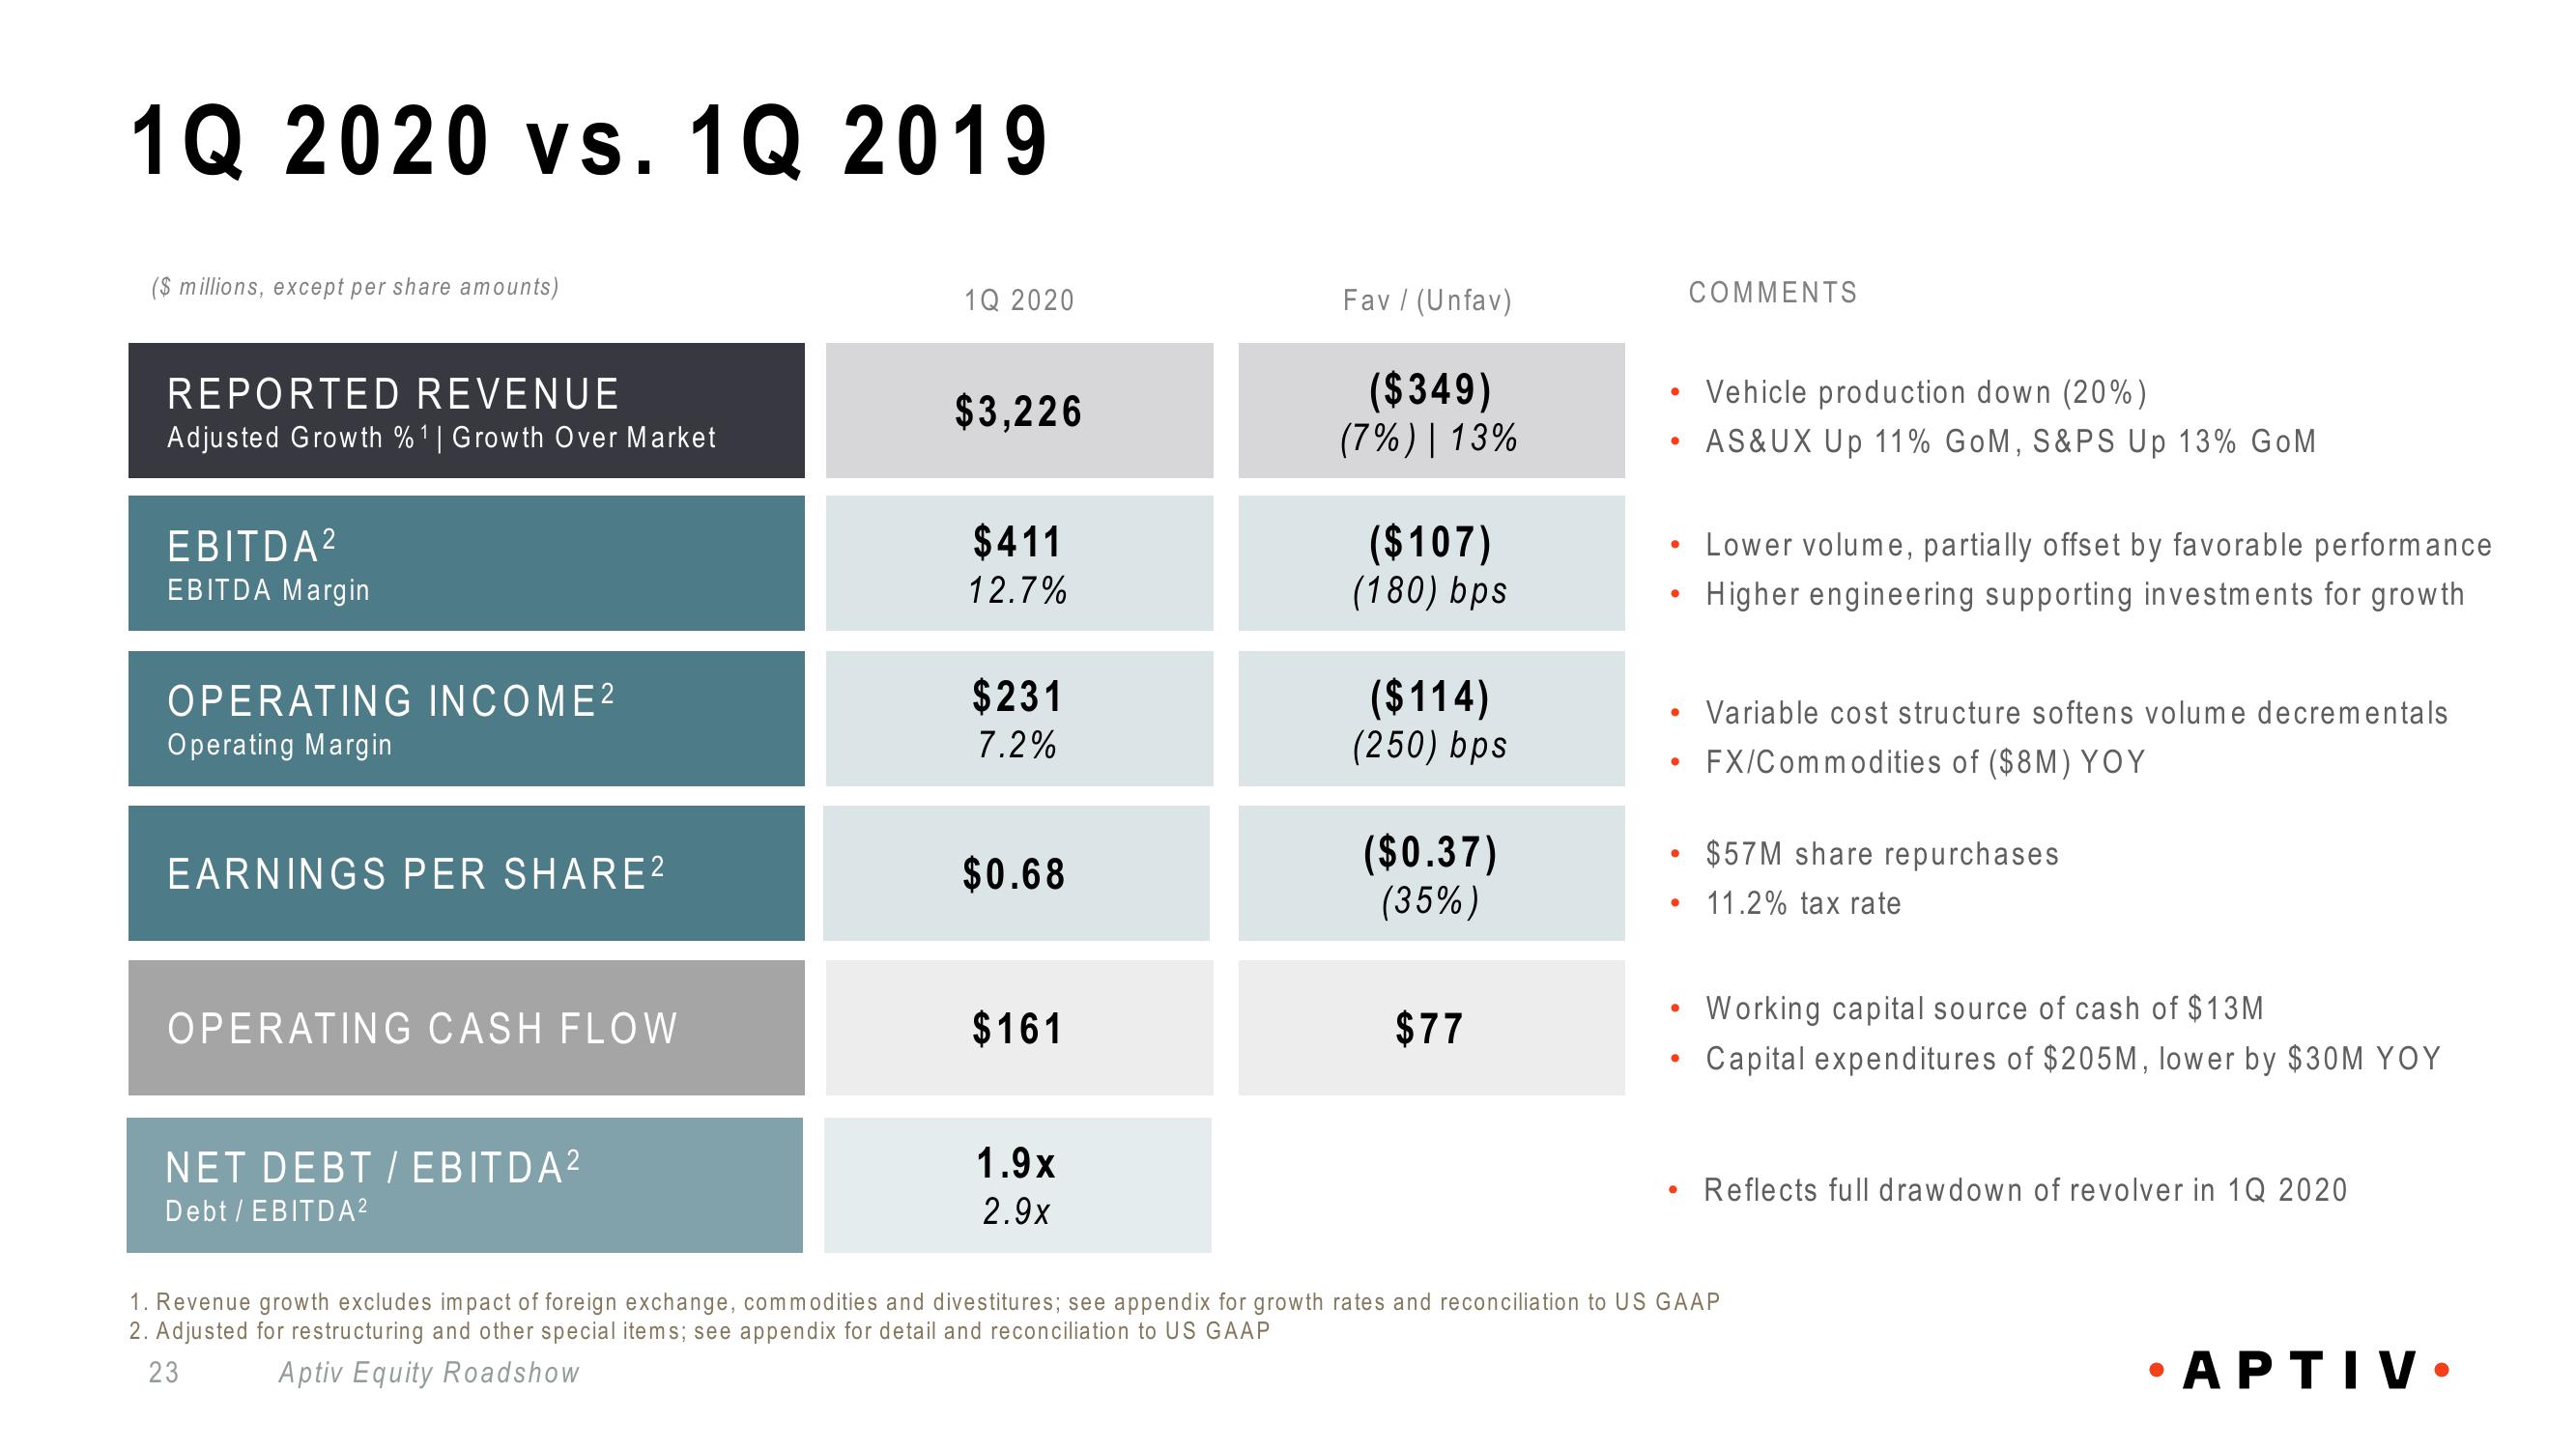
• Vehicle production down (20%)
AS&UX Up 11% GoM, S&PS Up 13% GoM
●
●
●
●
●
●
●
COMMENTS
●
Lower volume, partially offset by favorable performance
Higher engineering supporting investments for growth
Variable cost structure softens volume decrementals
FX/Commodities of ($8M) YOY
$57M share repurchases
11.2% tax rate
Working capital source of cash of $13M
Capital expenditures of $205M, lower by $30M YOY
Reflects full drawdown of revolver in 1Q 2020
1. Revenue growth excludes impact of foreign exchange, commodities and divestitures; see appendix for growth rates and reconciliation to US GAAP
2. Adjusted for restructuring and other special items; see appendix for detail and reconciliation to US GAAP
23
Aptiv Equity Roadshow
•APTIV.View entire presentation