Palantir Results Presentation Deck
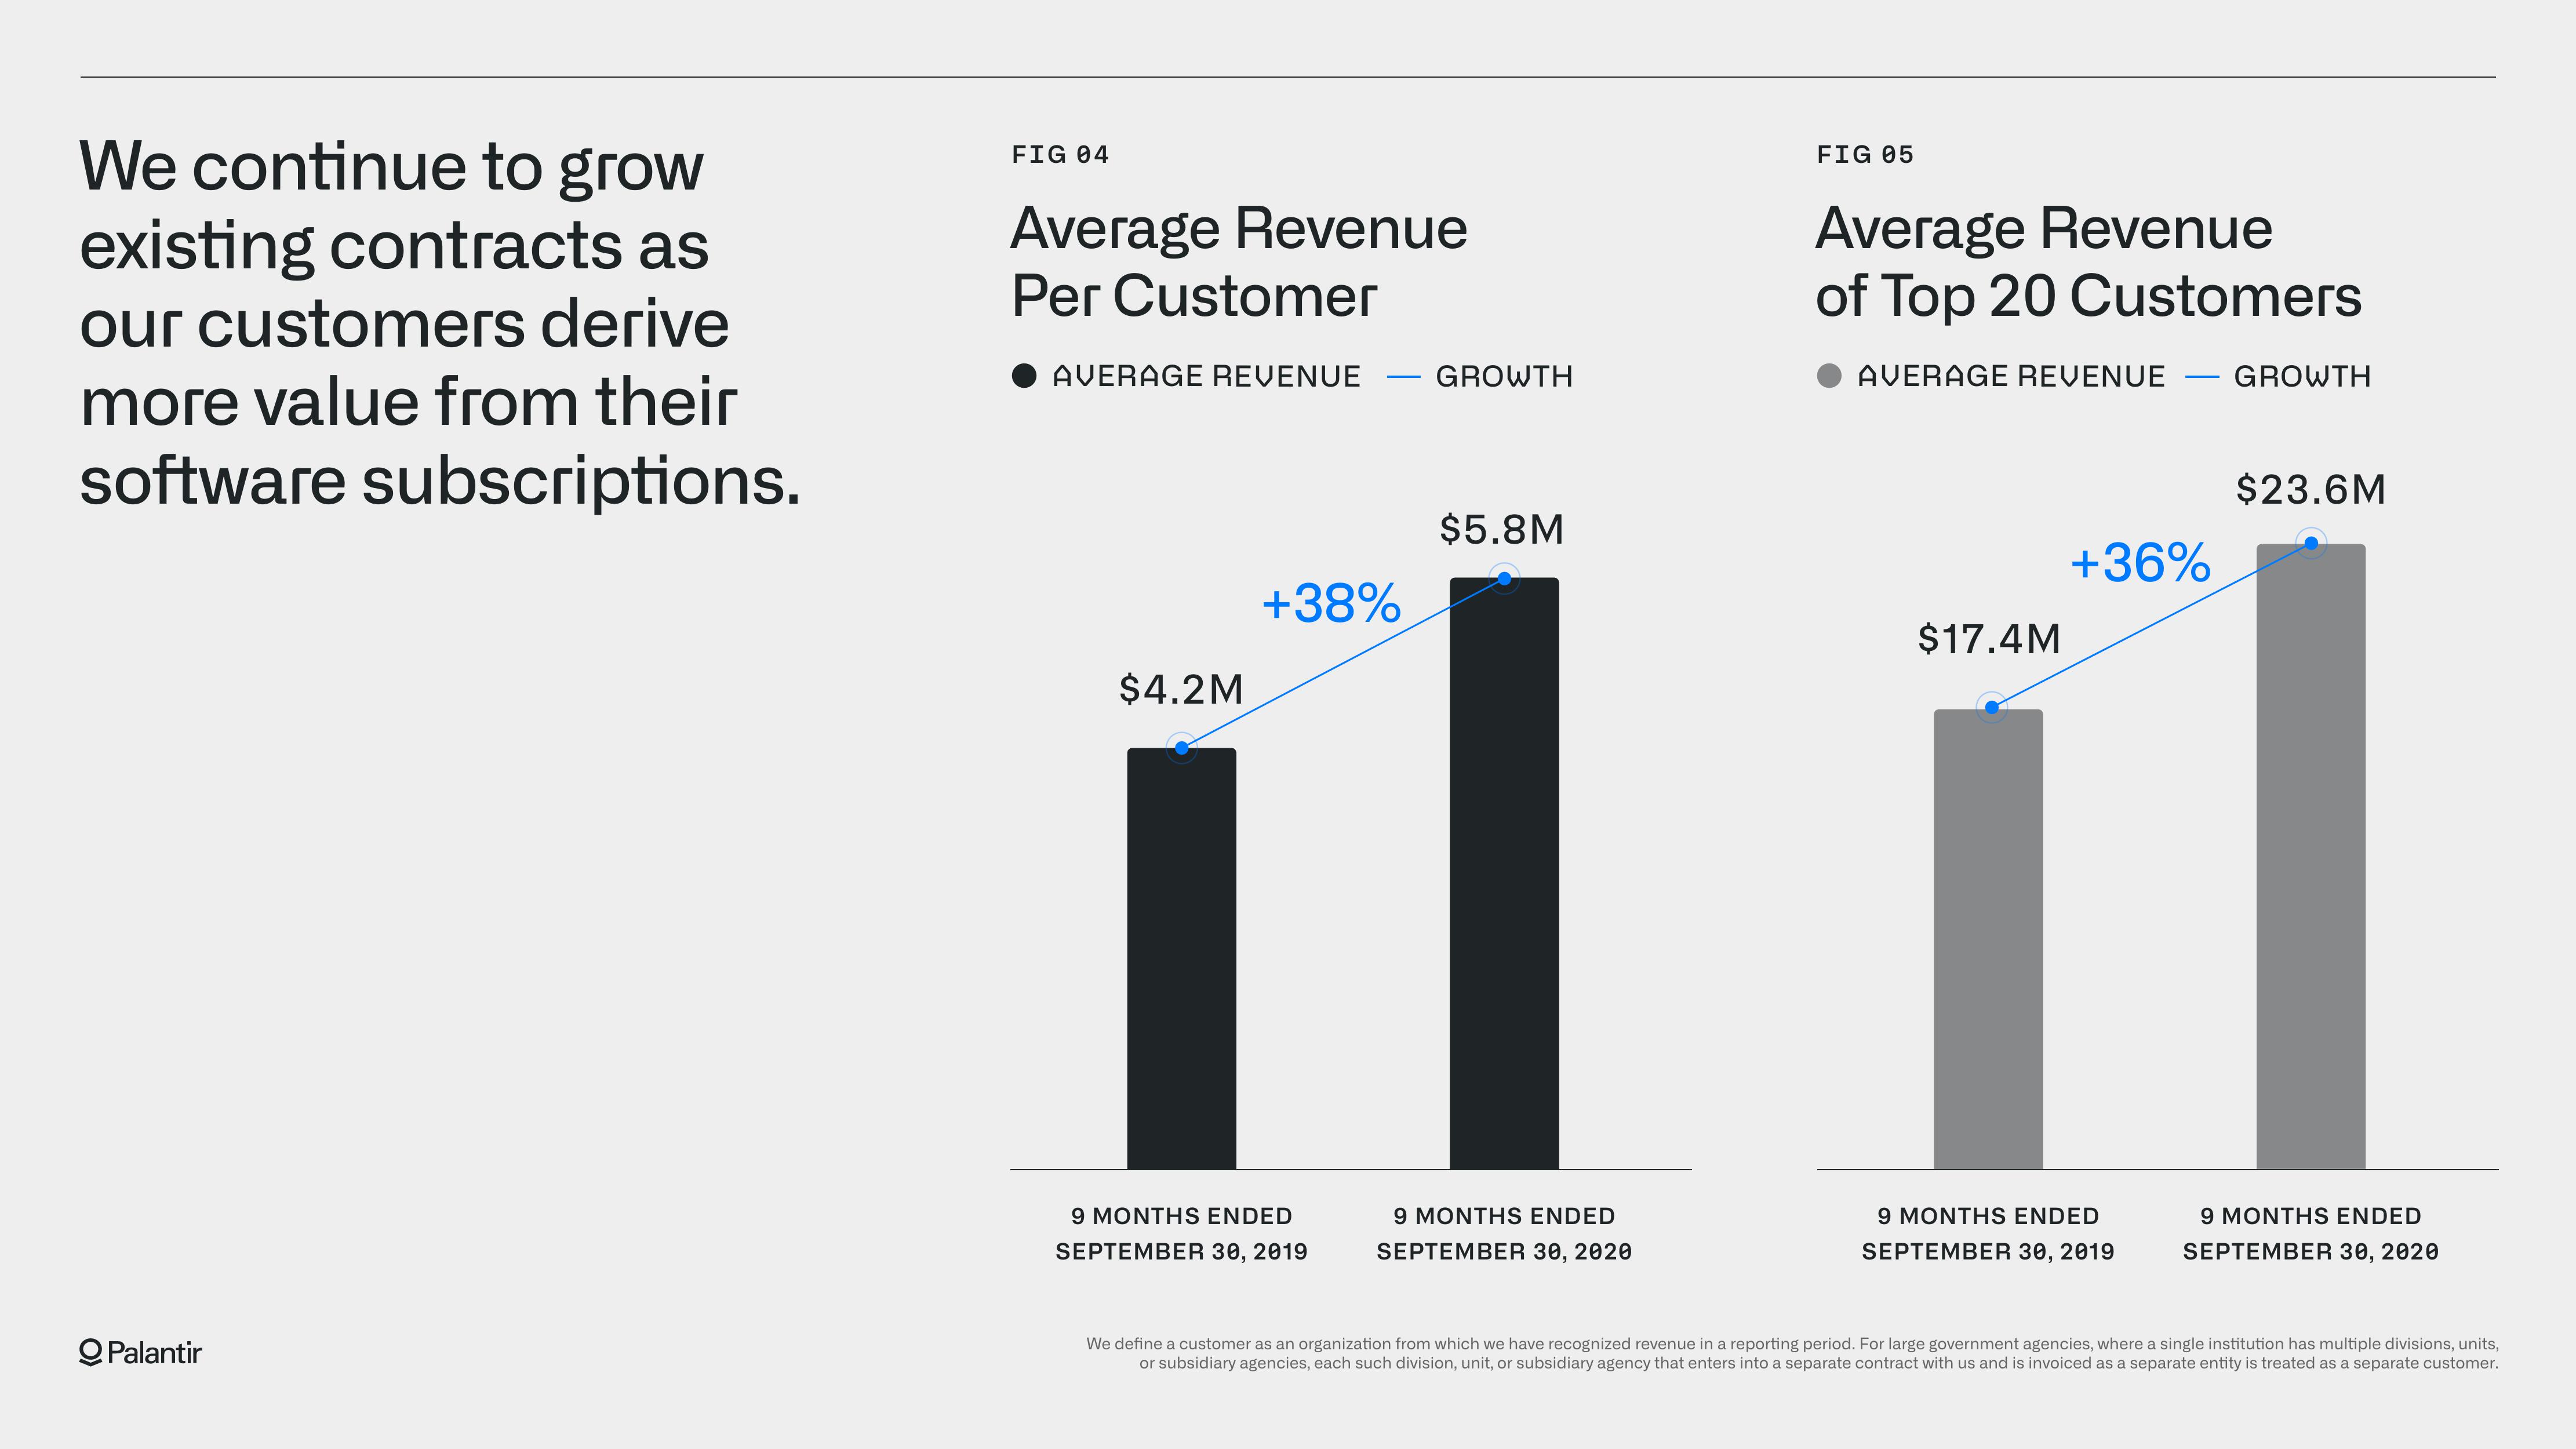
We continue to grow
existing contracts as
our customers derive
more value from their
software subscriptions.
QPalantir
FIG 04
Average Revenue
Per Customer
AVERAGE REVENUE
$4.2M
+38%
9 MONTHS ENDED
SEPTEMBER 30, 2019
GROWTH
$5.8M
9 MONTHS ENDED
SEPTEMBER 30, 2020
FIG 05
Average Revenue
of Top 20 Customers
AVERAGE REVENUE
GROWTH
9 MONTHS ENDED
SEPTEMBER 30, 2019
$23.6M
+36%
$17.4M
11
9 MONTHS ENDED
SEPTEMBER 30, 2020
We define a customer as an organization from which we have recognized revenue in a reporting period. For large government agencies, where a single institution has multiple divisions, units,
or subsidiary agencies, each such division, unit, or subsidiary agency that enters into a separate contract with us and is invoiced as a separate entity is treated as a separate customer.View entire presentation