Flutter Results Presentation Deck slide image

Flutter Results Presentation Deck

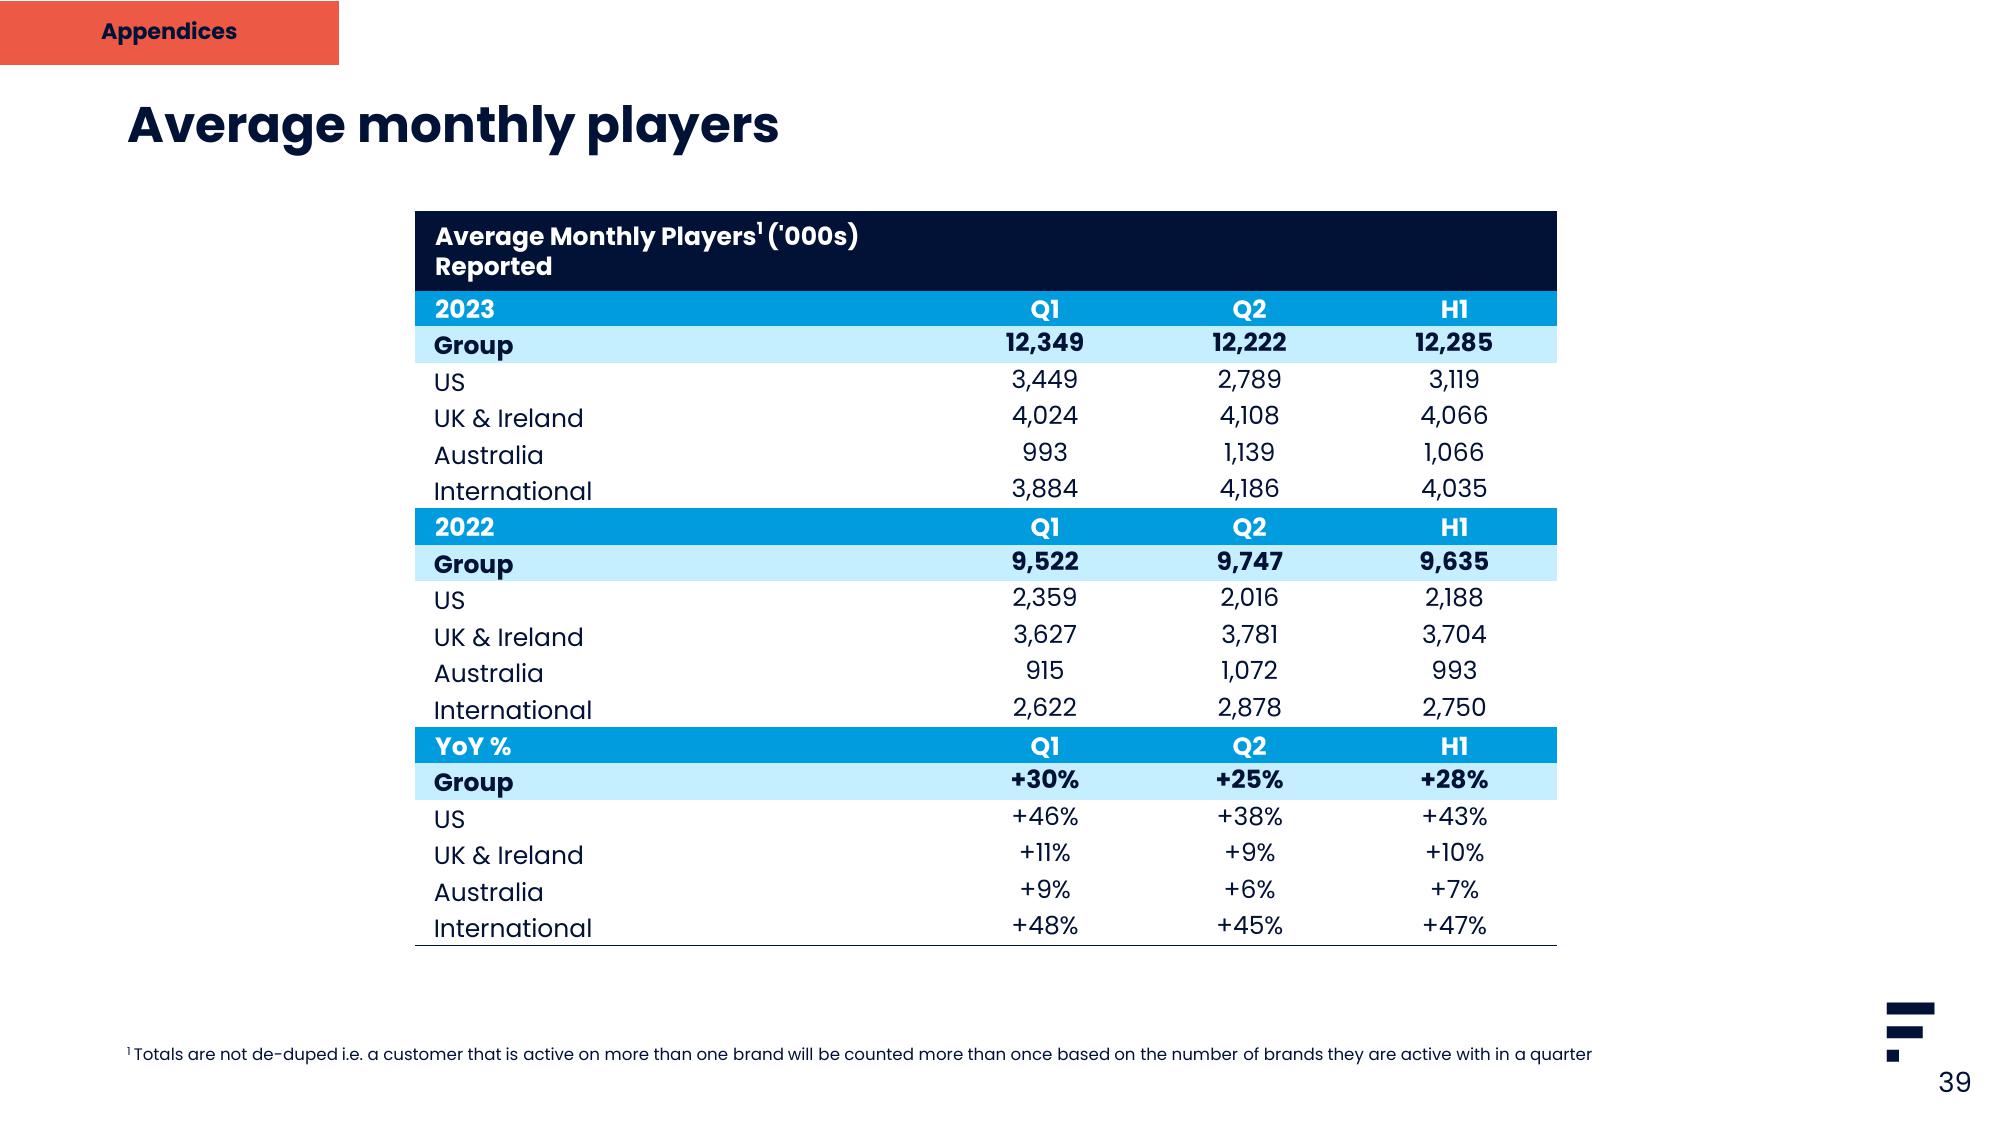
Appendices Average monthly players Average Monthly Players¹ ('000s) Reported 2023 Group US UK & Ireland Australia International 2022 Group US UK & Ireland Australia International YOY % Group US UK & Ireland Australia International Q1 12,349 3,449 4,024 993 3,884 Q1 9,522 2,359 3,627 915 2,622 Q1 +30% +46% +11% +9% +48% Q2 12,222 2,789 4,108 1,139 4,186 Q2 9,747 2,016 3,781 1,072 2,878 Q2 +25% +38% +9% +6% +45% Н1 12,285 3,119 4,066 1,066 4,035 Н1 9,635 2,188 3,704 993 2,750 Н1 +28% +43% +10% +7% +47% ¹ Totals are not de-duped i.e. a customer that is active on more than one brand will be counted more than once based on the number of brands they are active with in a quarter F II. 39
View entire presentation