Telia Company Results Presentation Deck
FINLAND
Service revenues
Reported currency, in millions, like for like growth
-1.0%
3,085 3,231
Q3 20 Q4 20
■ Consumer
●
2,991 3,017 3,007
Q1 21
Enterprise
Q2 21 Q3 21
Other
Adj EBITDA
Reported currency, in millions, like for like growth
-4.5%
1,280
I
1,154
Q3 20 Q4 20
1,070 1,046
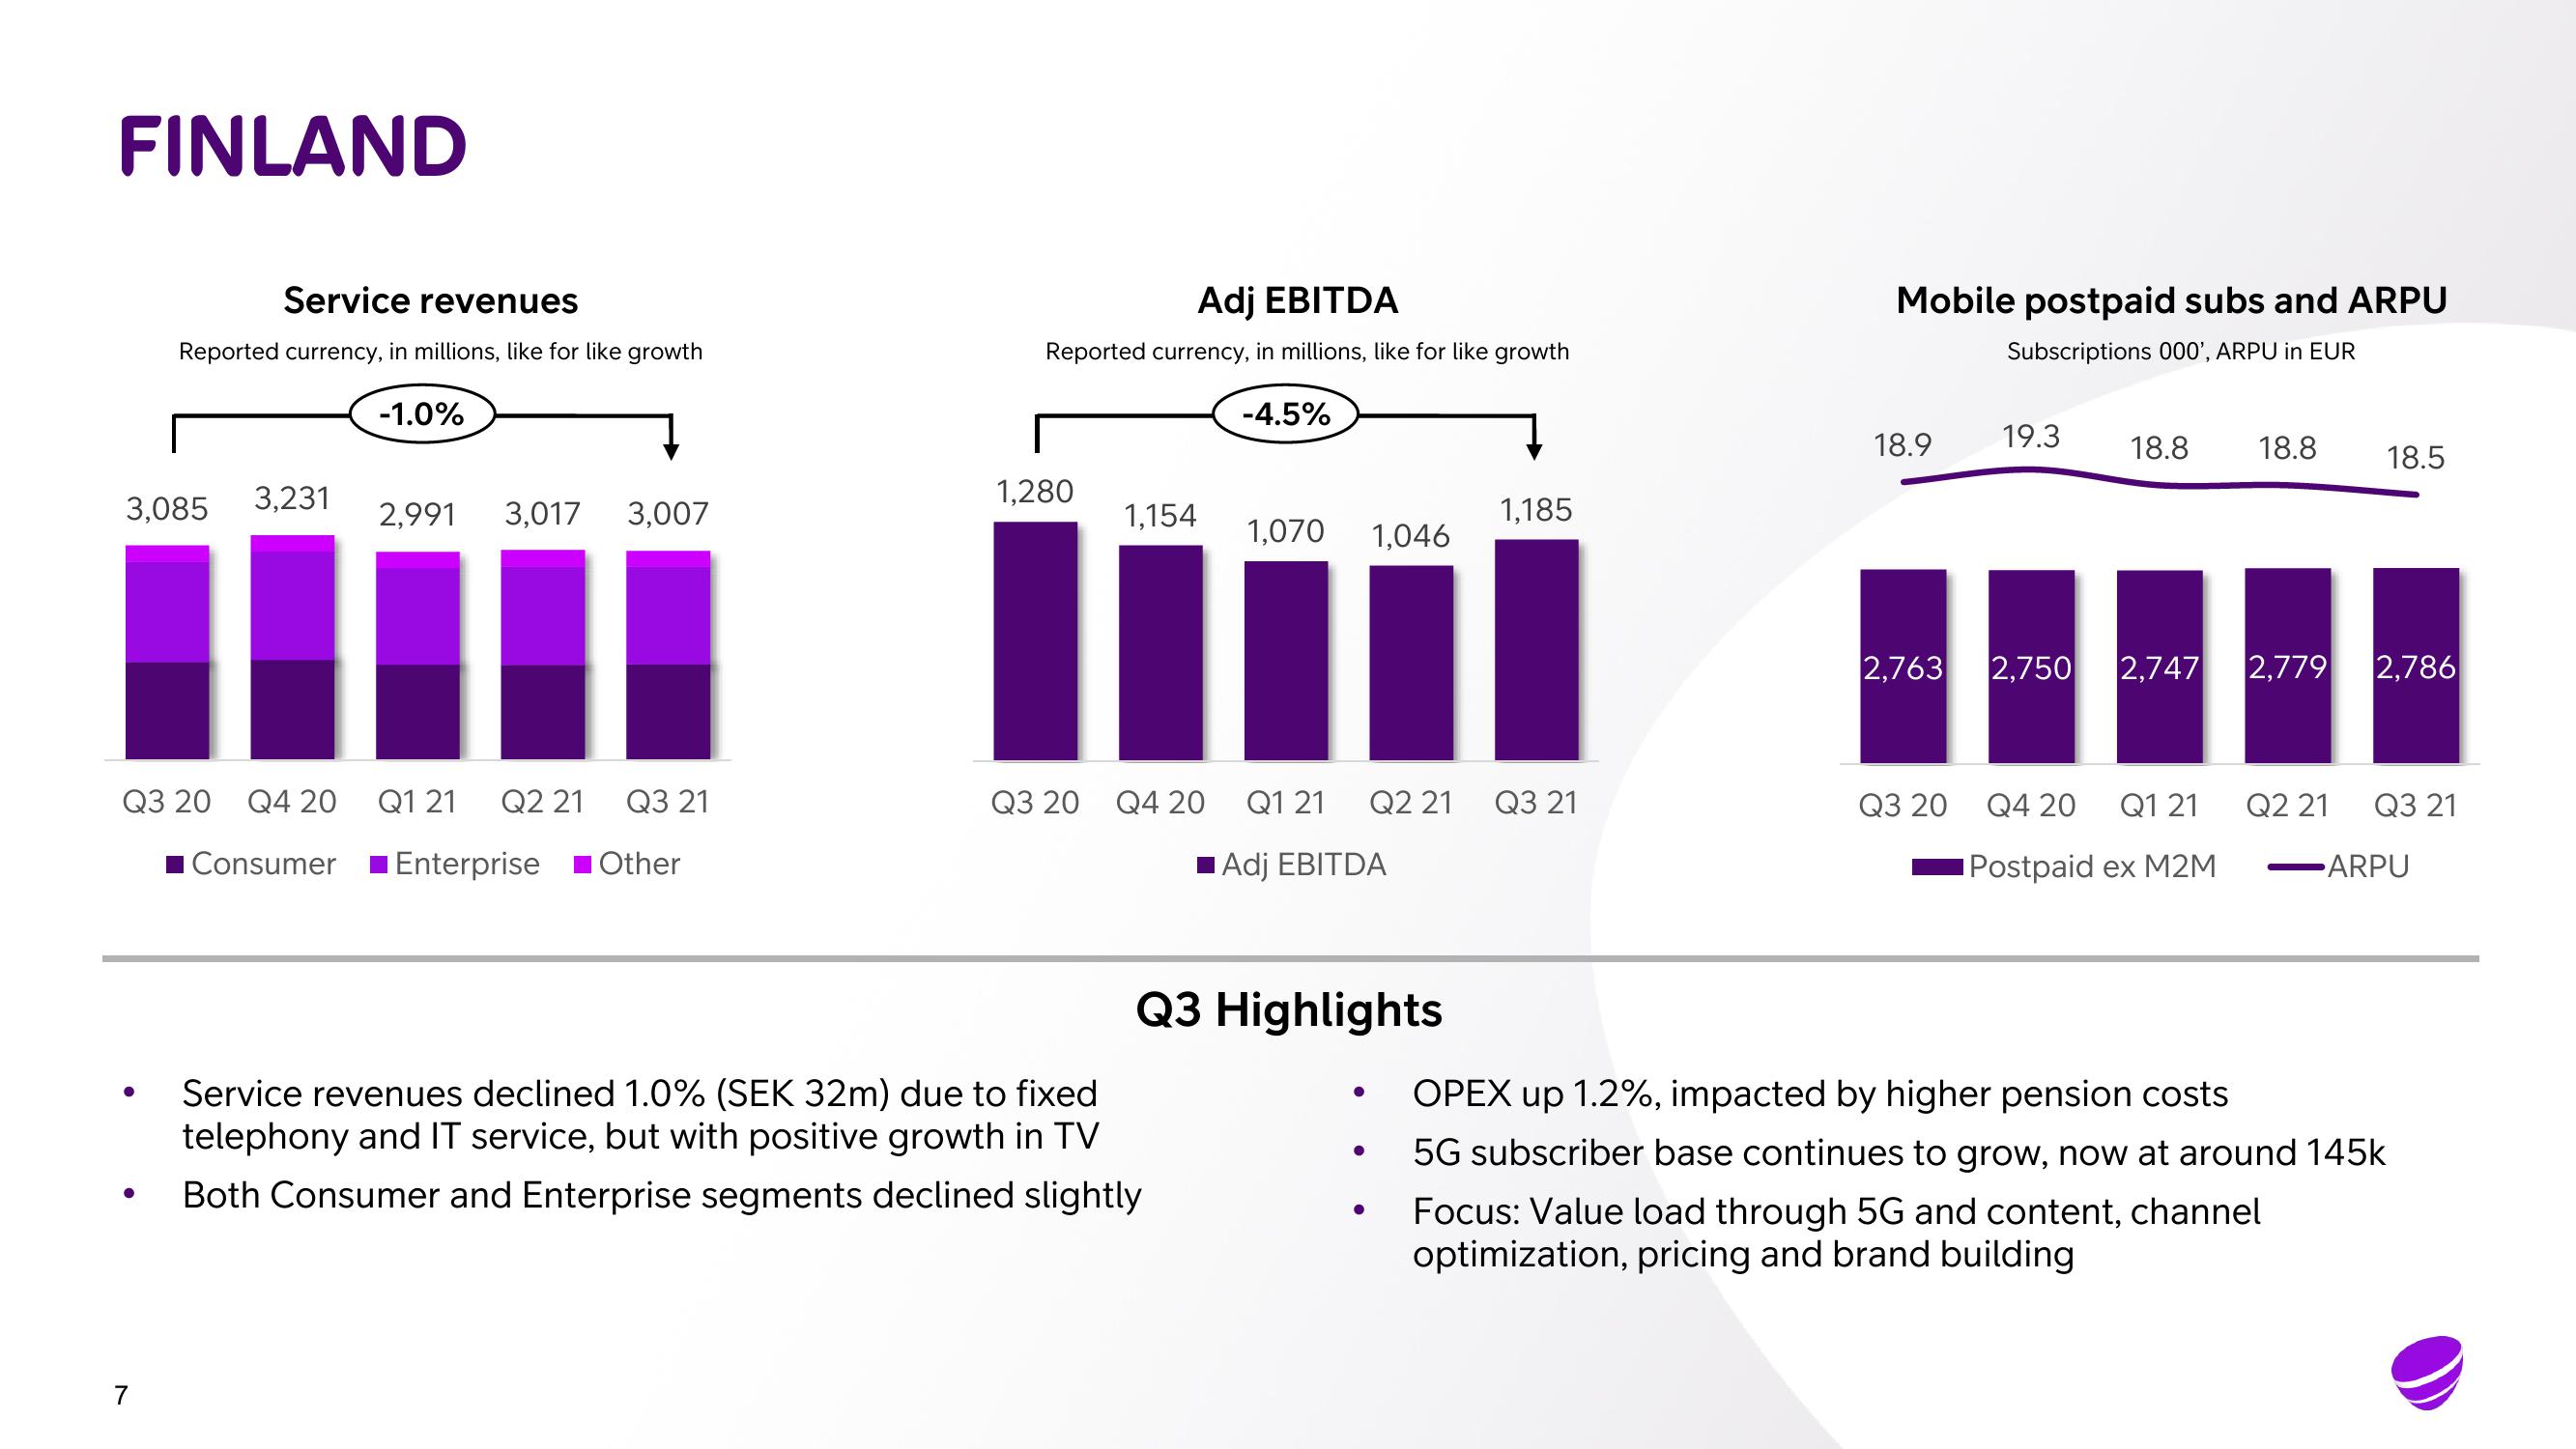
Service revenues declined 1.0% (SEK 32m) due to fixed
telephony and IT service, but with positive growth in TV
Both Consumer and Enterprise segments declined slightly
Q1 21
Adj EBITDA
Q3 Highlights
●
Q2 21
●
●
1,185
Q3 21
Mobile postpaid subs and ARPU
Subscriptions 000', ARPU in EUR
18.9 19.3
2,763 2,750
Q3 20
18.8 18.8 18.5
2,747 2,779 2,786
Q4 20 Q1 21
Postpaid ex M2M
Q2 21
Q3 21
ARPU
OPEX up 1.2%, impacted by higher pension costs
5G subscriber base continues to grow, now at around 145k
Focus: Value load through 5G and content, channel
optimization, pricing and brand buildingView entire presentation