Despegar Results Presentation Deck
Robust Execution On Effective Strategies Led to Record Revenues and Q3 Adj. EBITDA
Since IPO
1 Revenue ($ M) vs Take Rate (%)
13.8%
13.8%
Take Rate
2
13.1%
145.6
8%
145.5
12.0
9%
158.7
12.5
1Q23
3Q22
4Q22
2Q23
3Q23
Quarterly Adj. EBITDA Evolution (% vs $M)
11%
17.3
12.8%
3Q-22
4Q-22
1Q-23
Adj. EBITDA as a % of Revenue
165.5
9.8
12%.
12.9%
20.2
178.1
14%
24.7
+22%
2Q-23
3Q-23
Adj. EBITDA in $ million
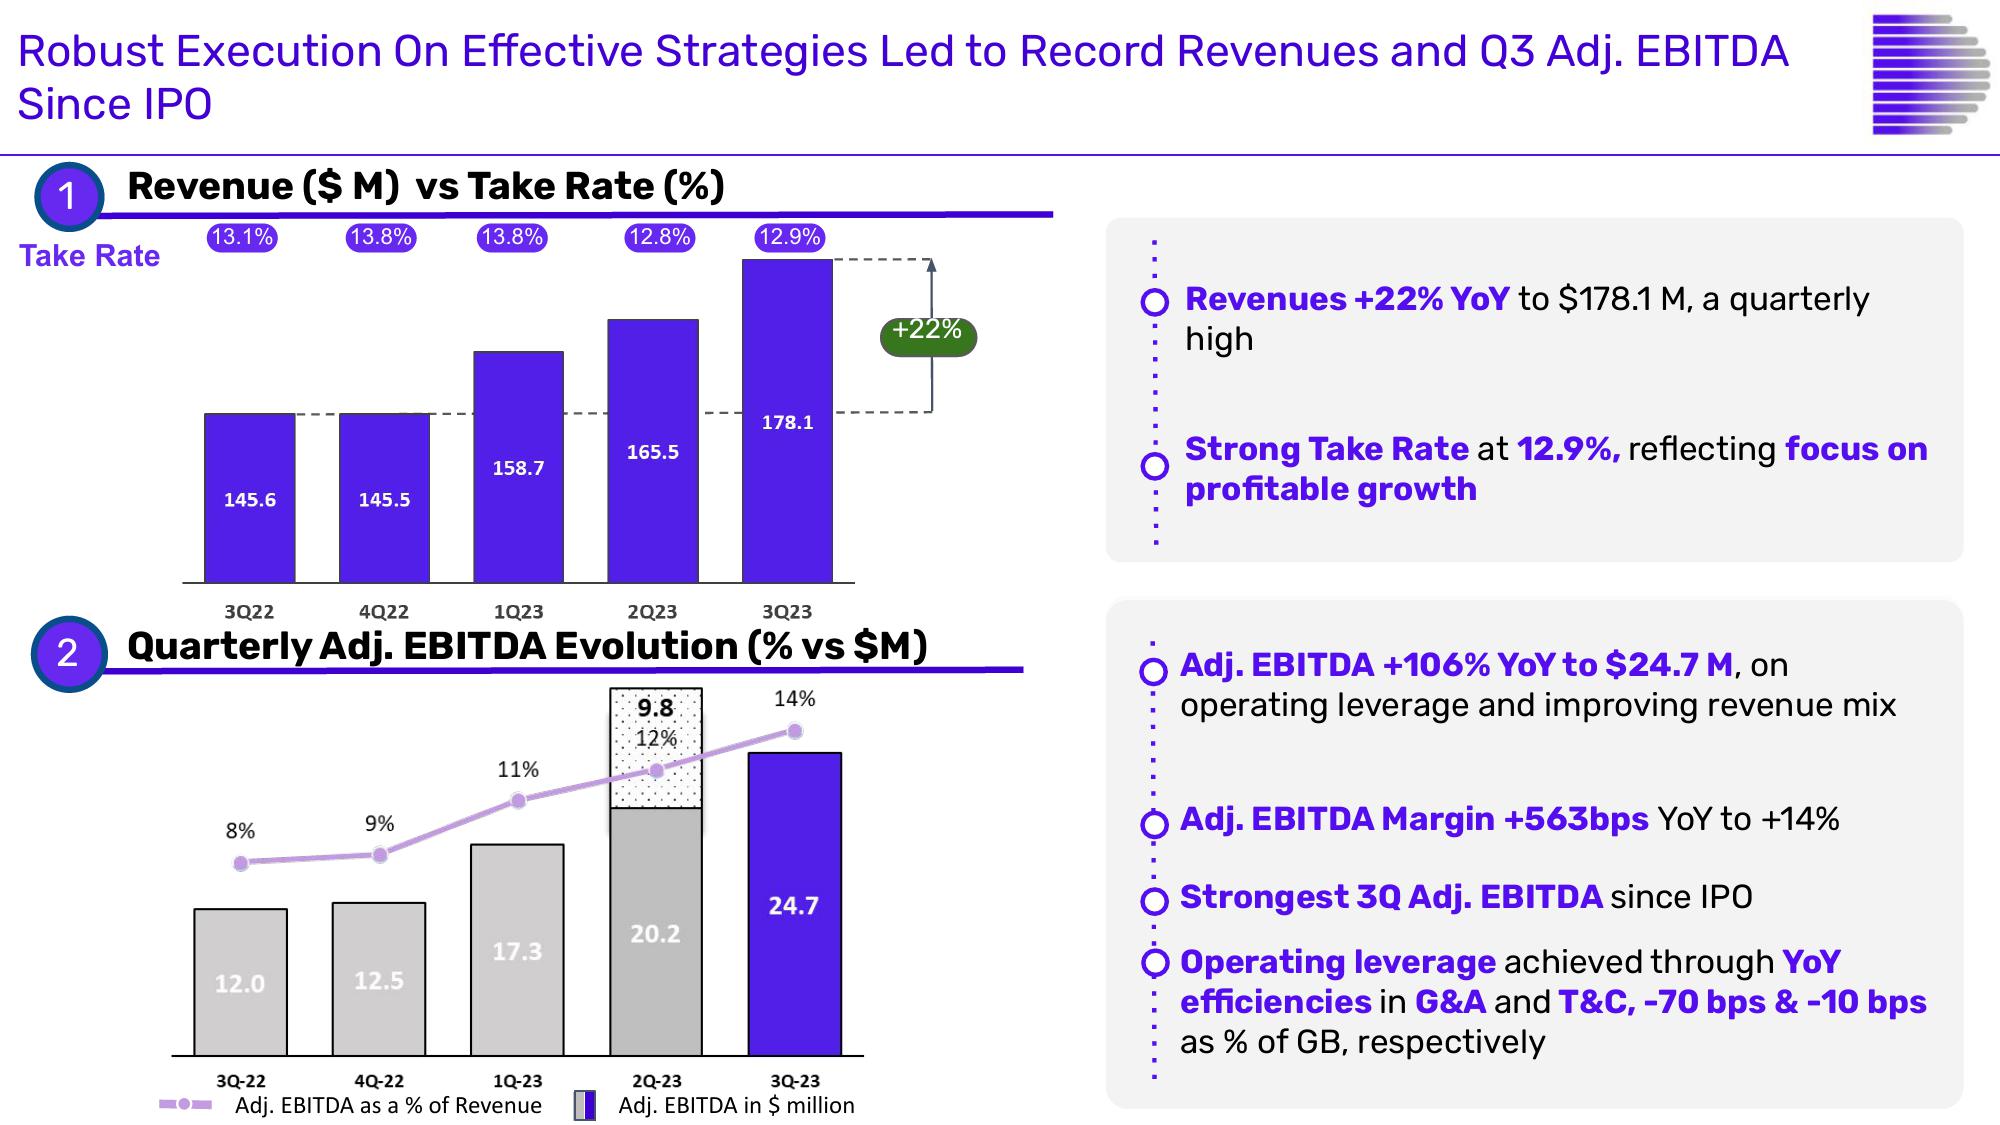
Revenues +22% YoY to $178.1 M, a quarterly
high
Strong Take Rate at 12.9%, reflecting focus on
profitable growth
Adj. EBITDA +106% YoY to $24.7 M, on
operating leverage and improving revenue mix
O Adj. EBITDA Margin +563bps YoY to +14%
Strongest 3Q Adj. EBITDA since IPO
Operating leverage achieved through YoY
: efficiencies in G&A and T&C, -70 bps & -10 bps
as % of GB, respectivelyView entire presentation