OppFi SPAC Presentation Deck
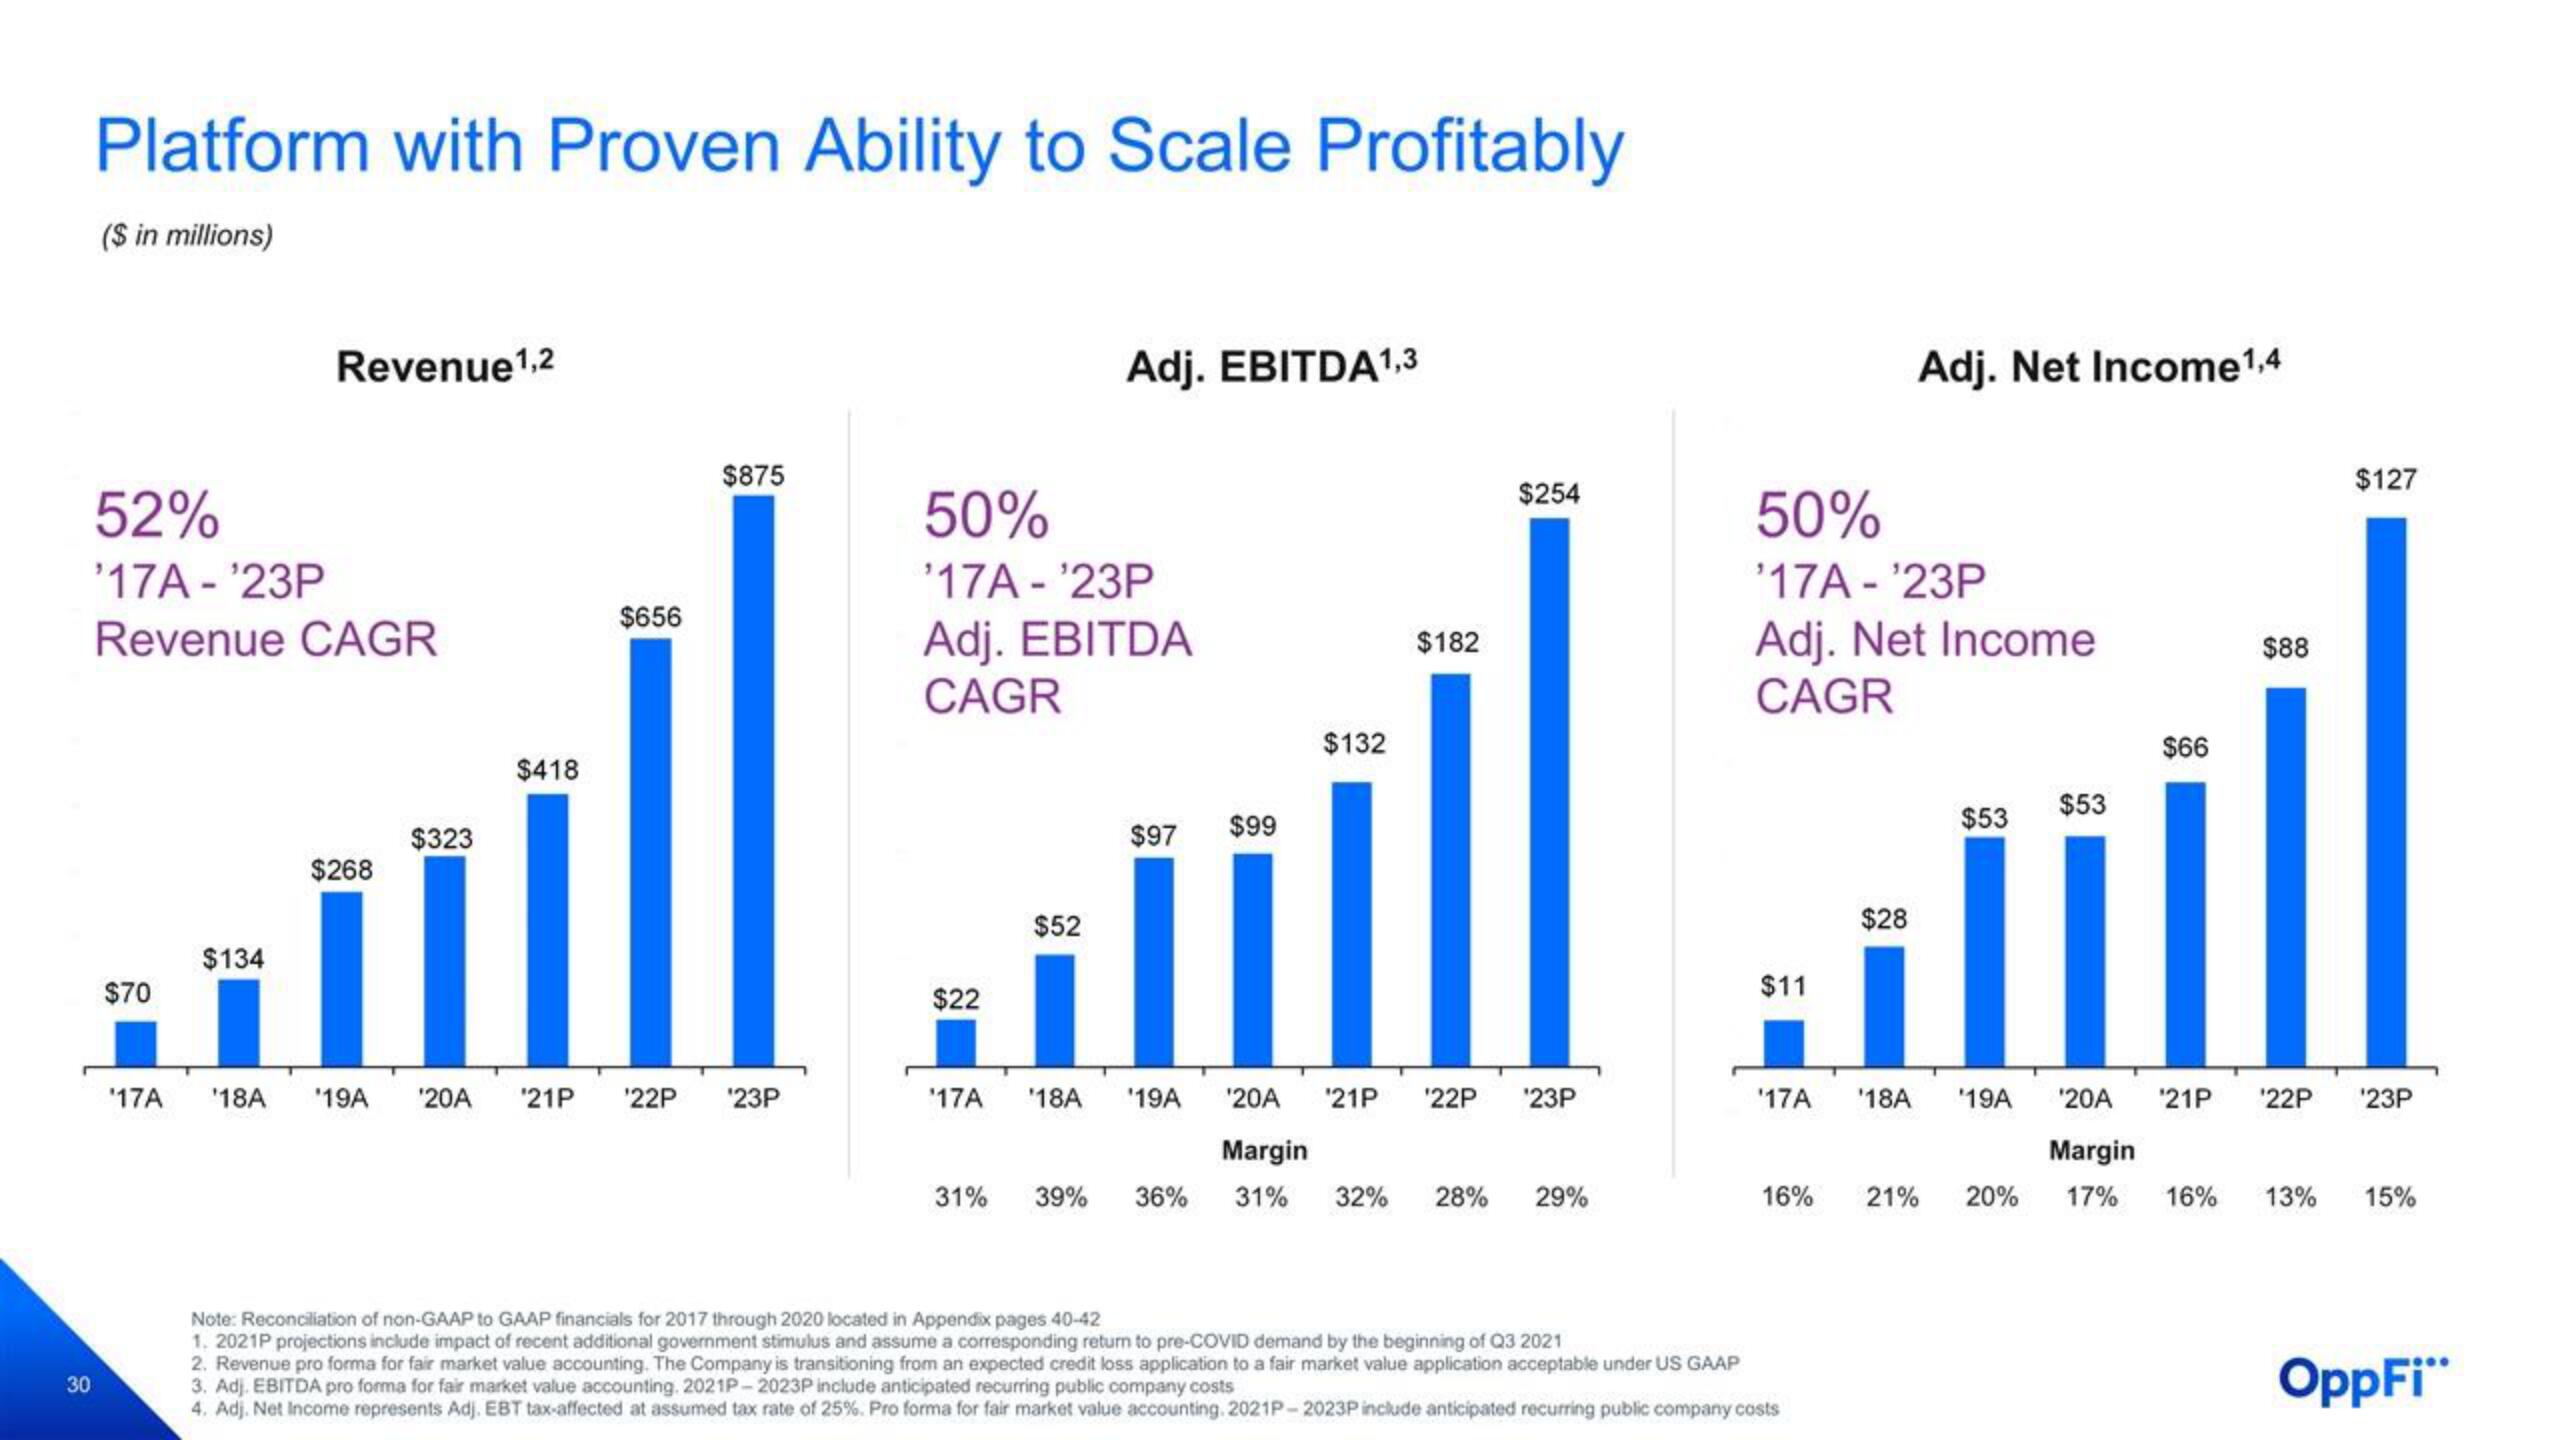
Platform with Proven Ability to Scale Profitably
($ in millions)
30
52%
'17A - ¹23P
Revenue CAGR
$70
'17A
Revenue ¹,2
$134
$268
$323
$418
$656
$875
'18A '19A '20A '21P '22P ¹23P
50%
¹17A - ¹23P
Adj. EBITDA
CAGR
$22
'17A
Adj. EBITDA1,3
$52
$97
'18A '19A
31% 39% 36%
$99
$132
$182
$254
¹20A '21P '22P
Margin
31% 32% 28% 29%
¹23P
50%
¹17A - ¹23P
Adj. Net Income
CAGR
$11
'17A
16%
Note: Reconciliation of non-GAAP to GAAP financials for 2017 through 2020 located in Appendix pages 40-42
1. 2021P projections include impact of recent additional government stimulus and assume a corresponding return to pre-COVID demand by the beginning of Q3 2021
2. Revenue pro forma for fair market value accounting. The Company is transitioning from an expected credit loss application to a fair market value application acceptable under US GAAP
3. Adj. EBITDA pro forma for fair market value accounting. 2021P-2023P include anticipated recurring public company costs
4. Adj. Net Income represents Adj. EBT tax-affected at assumed tax rate of 25%. Pro forma for fair market value accounting. 2021P-2023P include anticipated recurring public company costs
$28
Adj. Net Income ¹,4
'18A
$53
$53
11
'19A
$66
$88
$127
'20A '21P '¹22P ¹23P
Margin
21% 20% 17% 16% 13%
15%
OppFi"View entire presentation