Yellow Corporation Investor Conference Presentation Deck
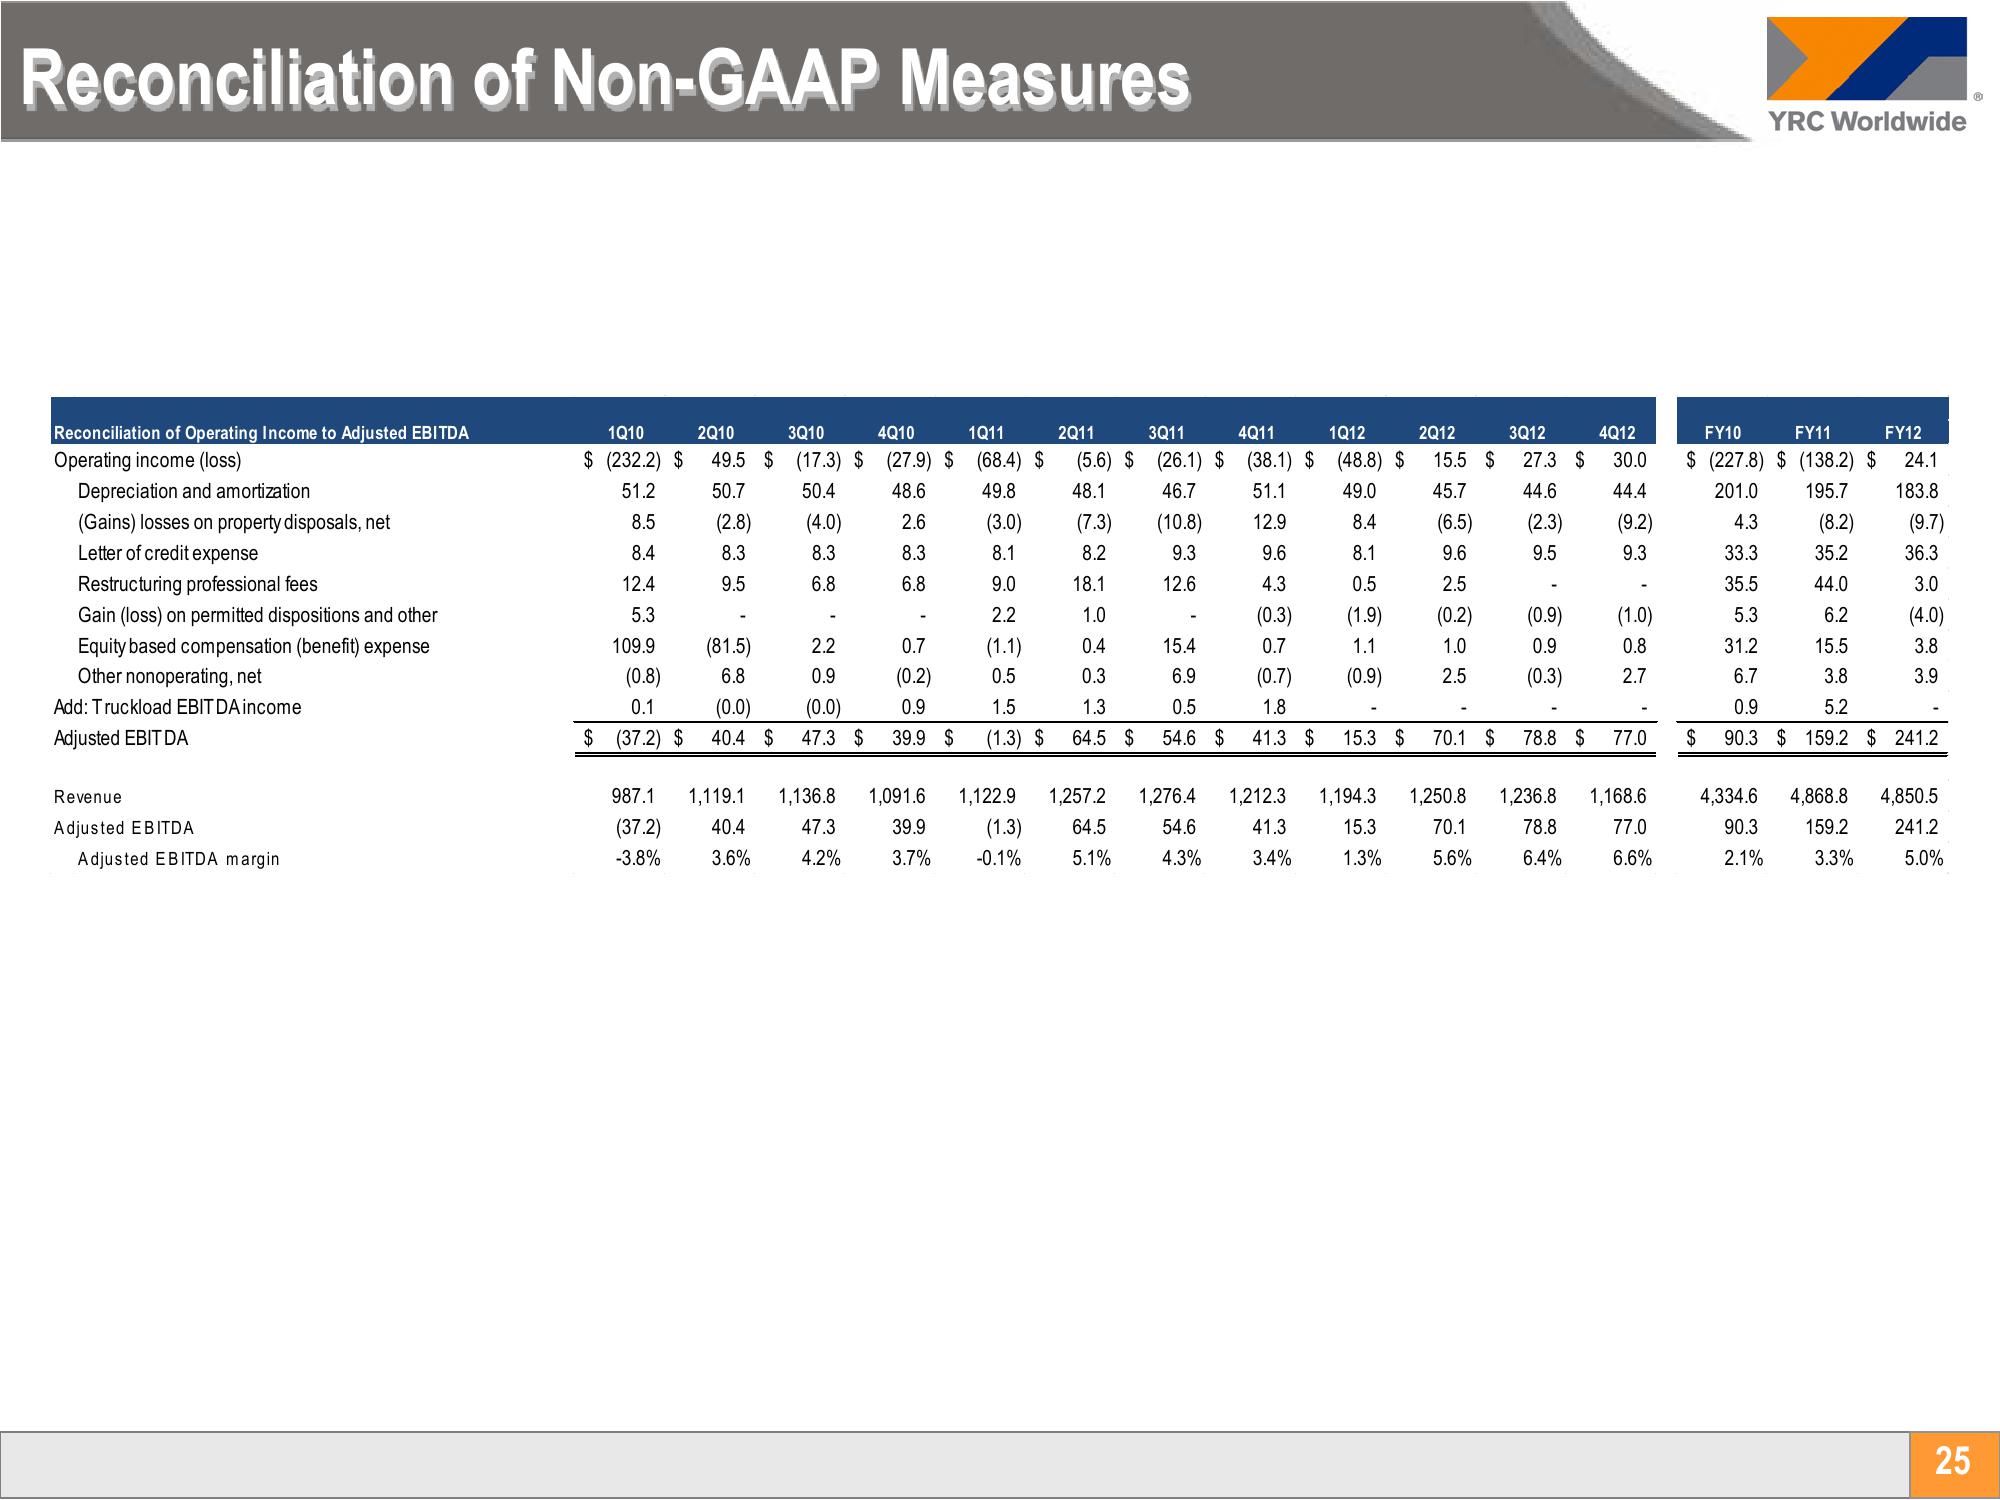
Reconciliation of Non-GAAP Measures
Reconciliation of Operating Income to Adjusted EBITDA
Operating income (loss)
Depreciation and amortization
(Gains) losses on property disposals, net
Letter of credit expense
Restructuring professional fees
Gain (loss) on permitted dispositions and other
Equity based compensation (benefit) expense
Other nonoperating, net
Add: Truckload EBITDA income
Adjusted EBIT DA
Revenue
Adjusted EBITDA
Adjusted EBITDA margin
1Q10
2Q10
3Q10
4Q10
1Q11
$ (232.2) $ 49.5 $ (17.3) $ (27.9) $ (68.4) $
51.2
50.7
50.4
48.6
49.8
8.5
2.6
8.4
8.3
12.4
6.8
5.3
109.9
987.1
(2.8)
8.3
9.5
(0.8)
0.1
(0.0)
$ (37.2) $ 40.4 $
(37.2)
-3.8%
(81.5)
6.8
1,119.1
40.4
3.6%
(4.0)
8.3
6.8
0.7
(0.2)
0.9
2.2
0.9
(0.0)
47.3 $ 39.9 $
1,136.8 1,091.6
47.3
39.9
4.2%
3.7%
(3.0)
8.1
9.0
2.2
(1.1)
0.5
1.5
(1.3) $
1,122.9
(1.3)
-0.1%
2Q11
3Q11
4Q11
1Q12
48.1
(5.6) $ (26.1) $ (38.1) $ (48.8) $
46.7 51.1 49.0
(10.8) 12.9
9.3
8.4
9.6
8.1
12.6
4.3
0.5
(0.3)
0.7
(1.9)
1.1
(0.9)
(0.7)
1.8
41.3 $
(7.3)
8.2
18.1
1.0
0.4
0.3
1.3
64.5 $
1,257.2
64.5
5.1%
15.4
6.9
0.5
54.6 $
1,276.4
54.6
4.3%
1,212.3
41.3
3.4%
15.3 $
2Q12
15.5 $
45.7
(6.5)
9.6
2.5
(0.2)
1.0
2.5
70.1 $
3Q12 4Q12
27.3 $
30.0
44.6
44.4
(2.3) (9.2)
9.5
9.3
(0.9)
0.9
(0.3)
(1.0)
0.8
2.7
78.8 $ 77.0
1,194.3 1,250.8 1,236.8 1,168.6
15.3 70.1
78.8 77.0
6.6%
1.3%
5.6%
6.4%
YRC Worldwide
$
FY10
FY11
$(227.8) $ (138.2) $
201.0 195.7
4.3 (8.2)
33.3
35.2
44.0
35.5
5.3
31.2
6.2
15.5
6.7
3.8
0.9
5.2
90.3 $159.2 $ 241.2
FY12
24.1
183.8
(9.7)
36.3
3.0
(4.0)
3.8
3.9
4,334.6 4,868.8 4,850.5
90.3 159.2 241.2
5.0%
2.1%
3.3%
25View entire presentation