Bausch+Lomb Results Presentation Deck
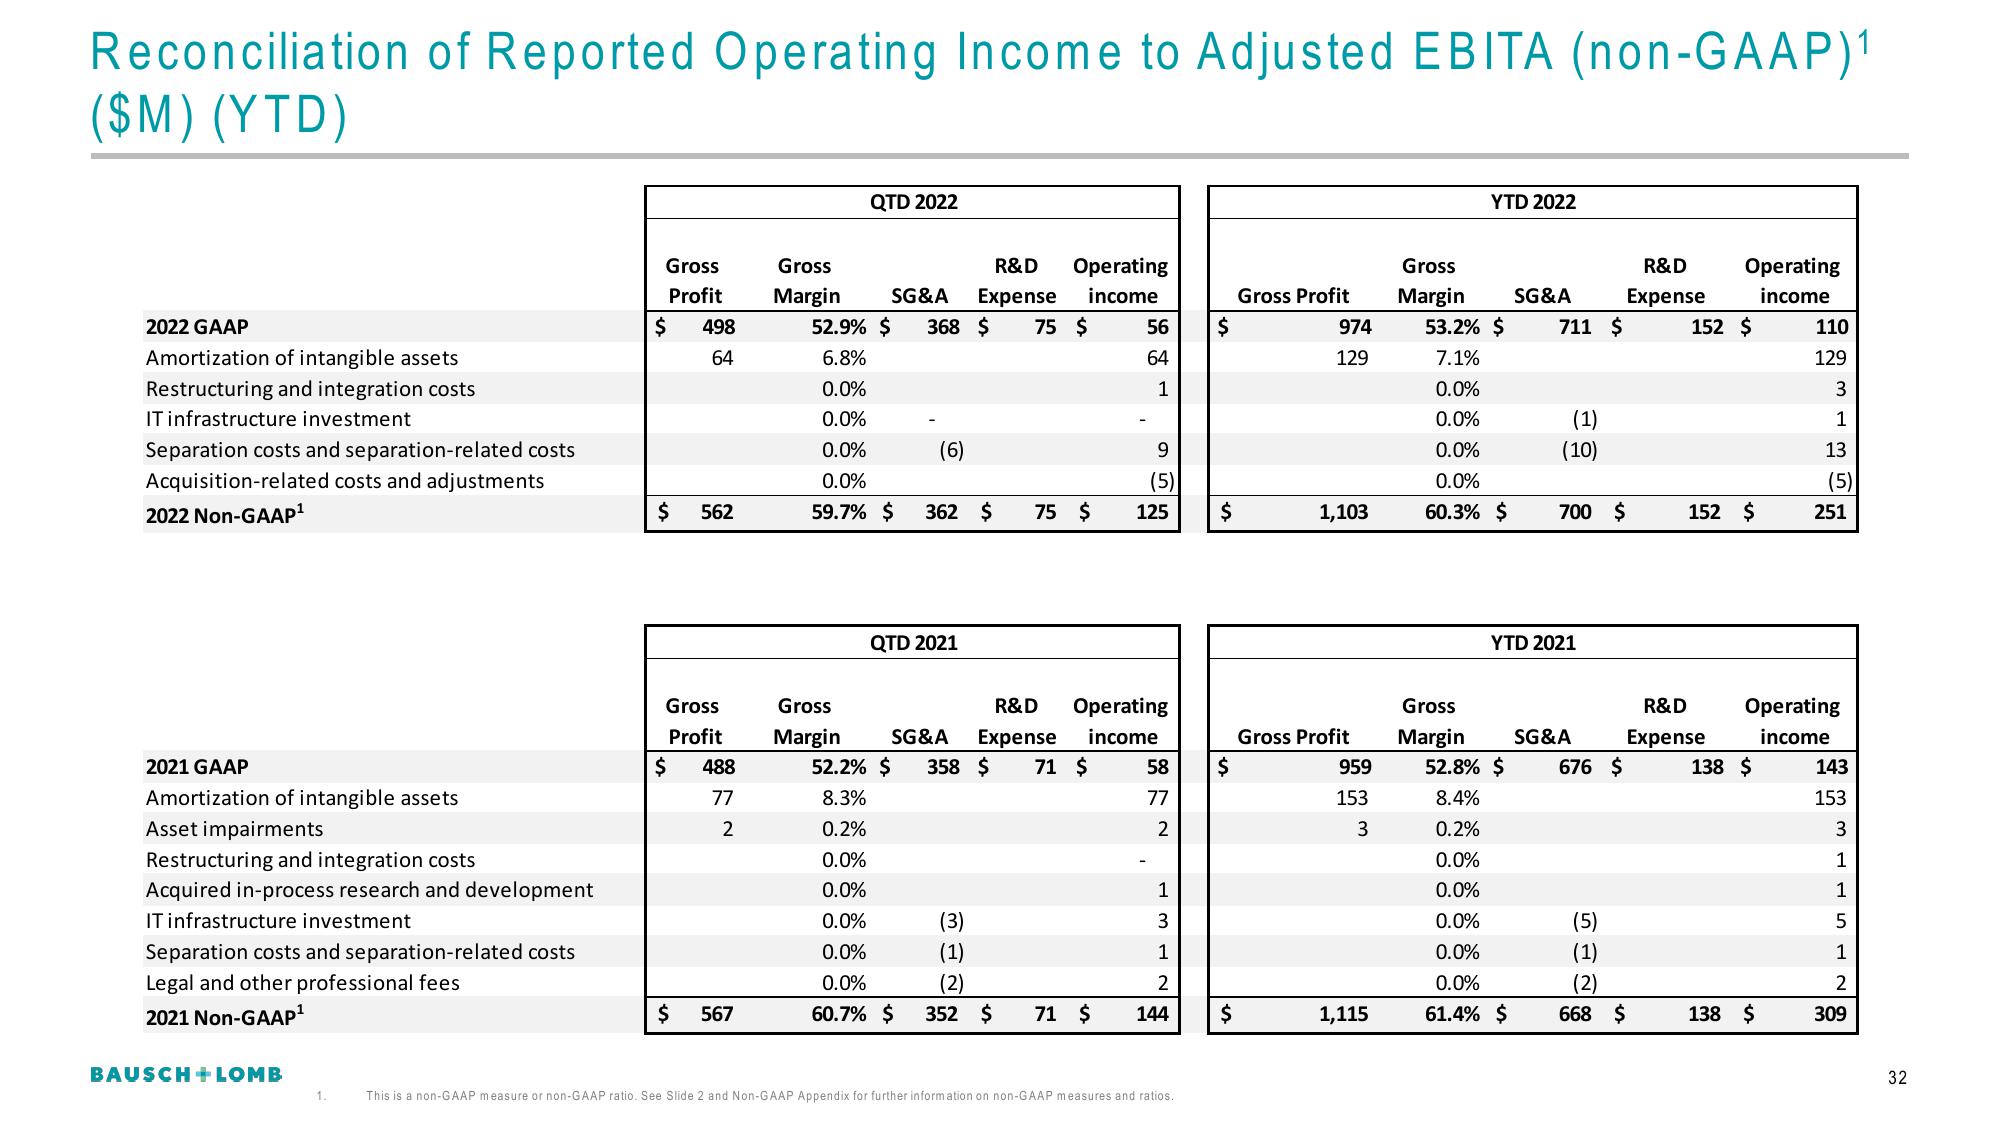
Reconciliation of Reported Operating Income to Adjusted EBITA (non-GAAP)1
($M) (YTD)
2022 GAAP
Amortization of intangible assets
Restructuring and integration costs
IT infrastructure investment
Separation costs and separation-related costs
Acquisition-related costs and adjustments
2022 Non-GAAP¹
2021 GAAP
Amortization of intangible assets
Asset impairments
Restructuring and integration costs
Acquired in-process research and development
IT infrastructure investment
Separation costs and separation-related costs
Legal and other professional fees
2021 Non-GAAP¹
BAUSCH + LOMB
1.
Gross
Profit
498
64
$
$
Gross
Profit
488
77
2
$
562
$
567
QTD 2022
R&D
Gross
Operating
Margin SG&A Expense income
52.9% $ 368 $ 75 $
6.8%
0.0%
0.0%
0.0%
0.0%
59.7% $
Gross
Margin
(6)
362 $
QTD 2021
75 $
R&D
SG&A Expense
52.2% $ 358 $ 71 $
8.3%
0.2%
0.0%
0.0%
0.0%
0.0%
0.0%
60.7% $
56
64
1
(3)
(1)
(2)
352 $ 71 $
9
(5)
Operating
income
125
58
77
2
1
3
1
2
144
This is a non-GAAP measure or non-GAAP ratio. See Slide 2 and Non-GAAP Appendix for further information on non-GAAP measures and ratios.
$
$
$
$
Gross Profit
974
129
1,103
Gross Profit
959
153
3
1,115
YTD 2022
Gross
Margin SG&A
53.2% $ 711 $
7.1%
0.0%
0.0%
0.0%
0.0%
60.3% $
(1)
(10)
Gross
Margin
52.8% $
8.4%
0.2%
0.0%
0.0%
0.0%
0.0%
0.0%
61.4% $
700 $
YTD 2021
SG&A
676 $
R&D
Expense
(5)
(1)
(2)
668 $
Operating
income
152 $
R&D
Expense
152 $
138 $
110
129
3
1
138 $
13
(5)
Operating
income
251
143
153
3
1
1
5
1
2
309
32View entire presentation