Telia Company Results Presentation Deck
OPEX & CAPEX
OPEX excl. energy
Like for like growth
Q1 22
Resources
+1.3%
Marketing
Other
Q1 23
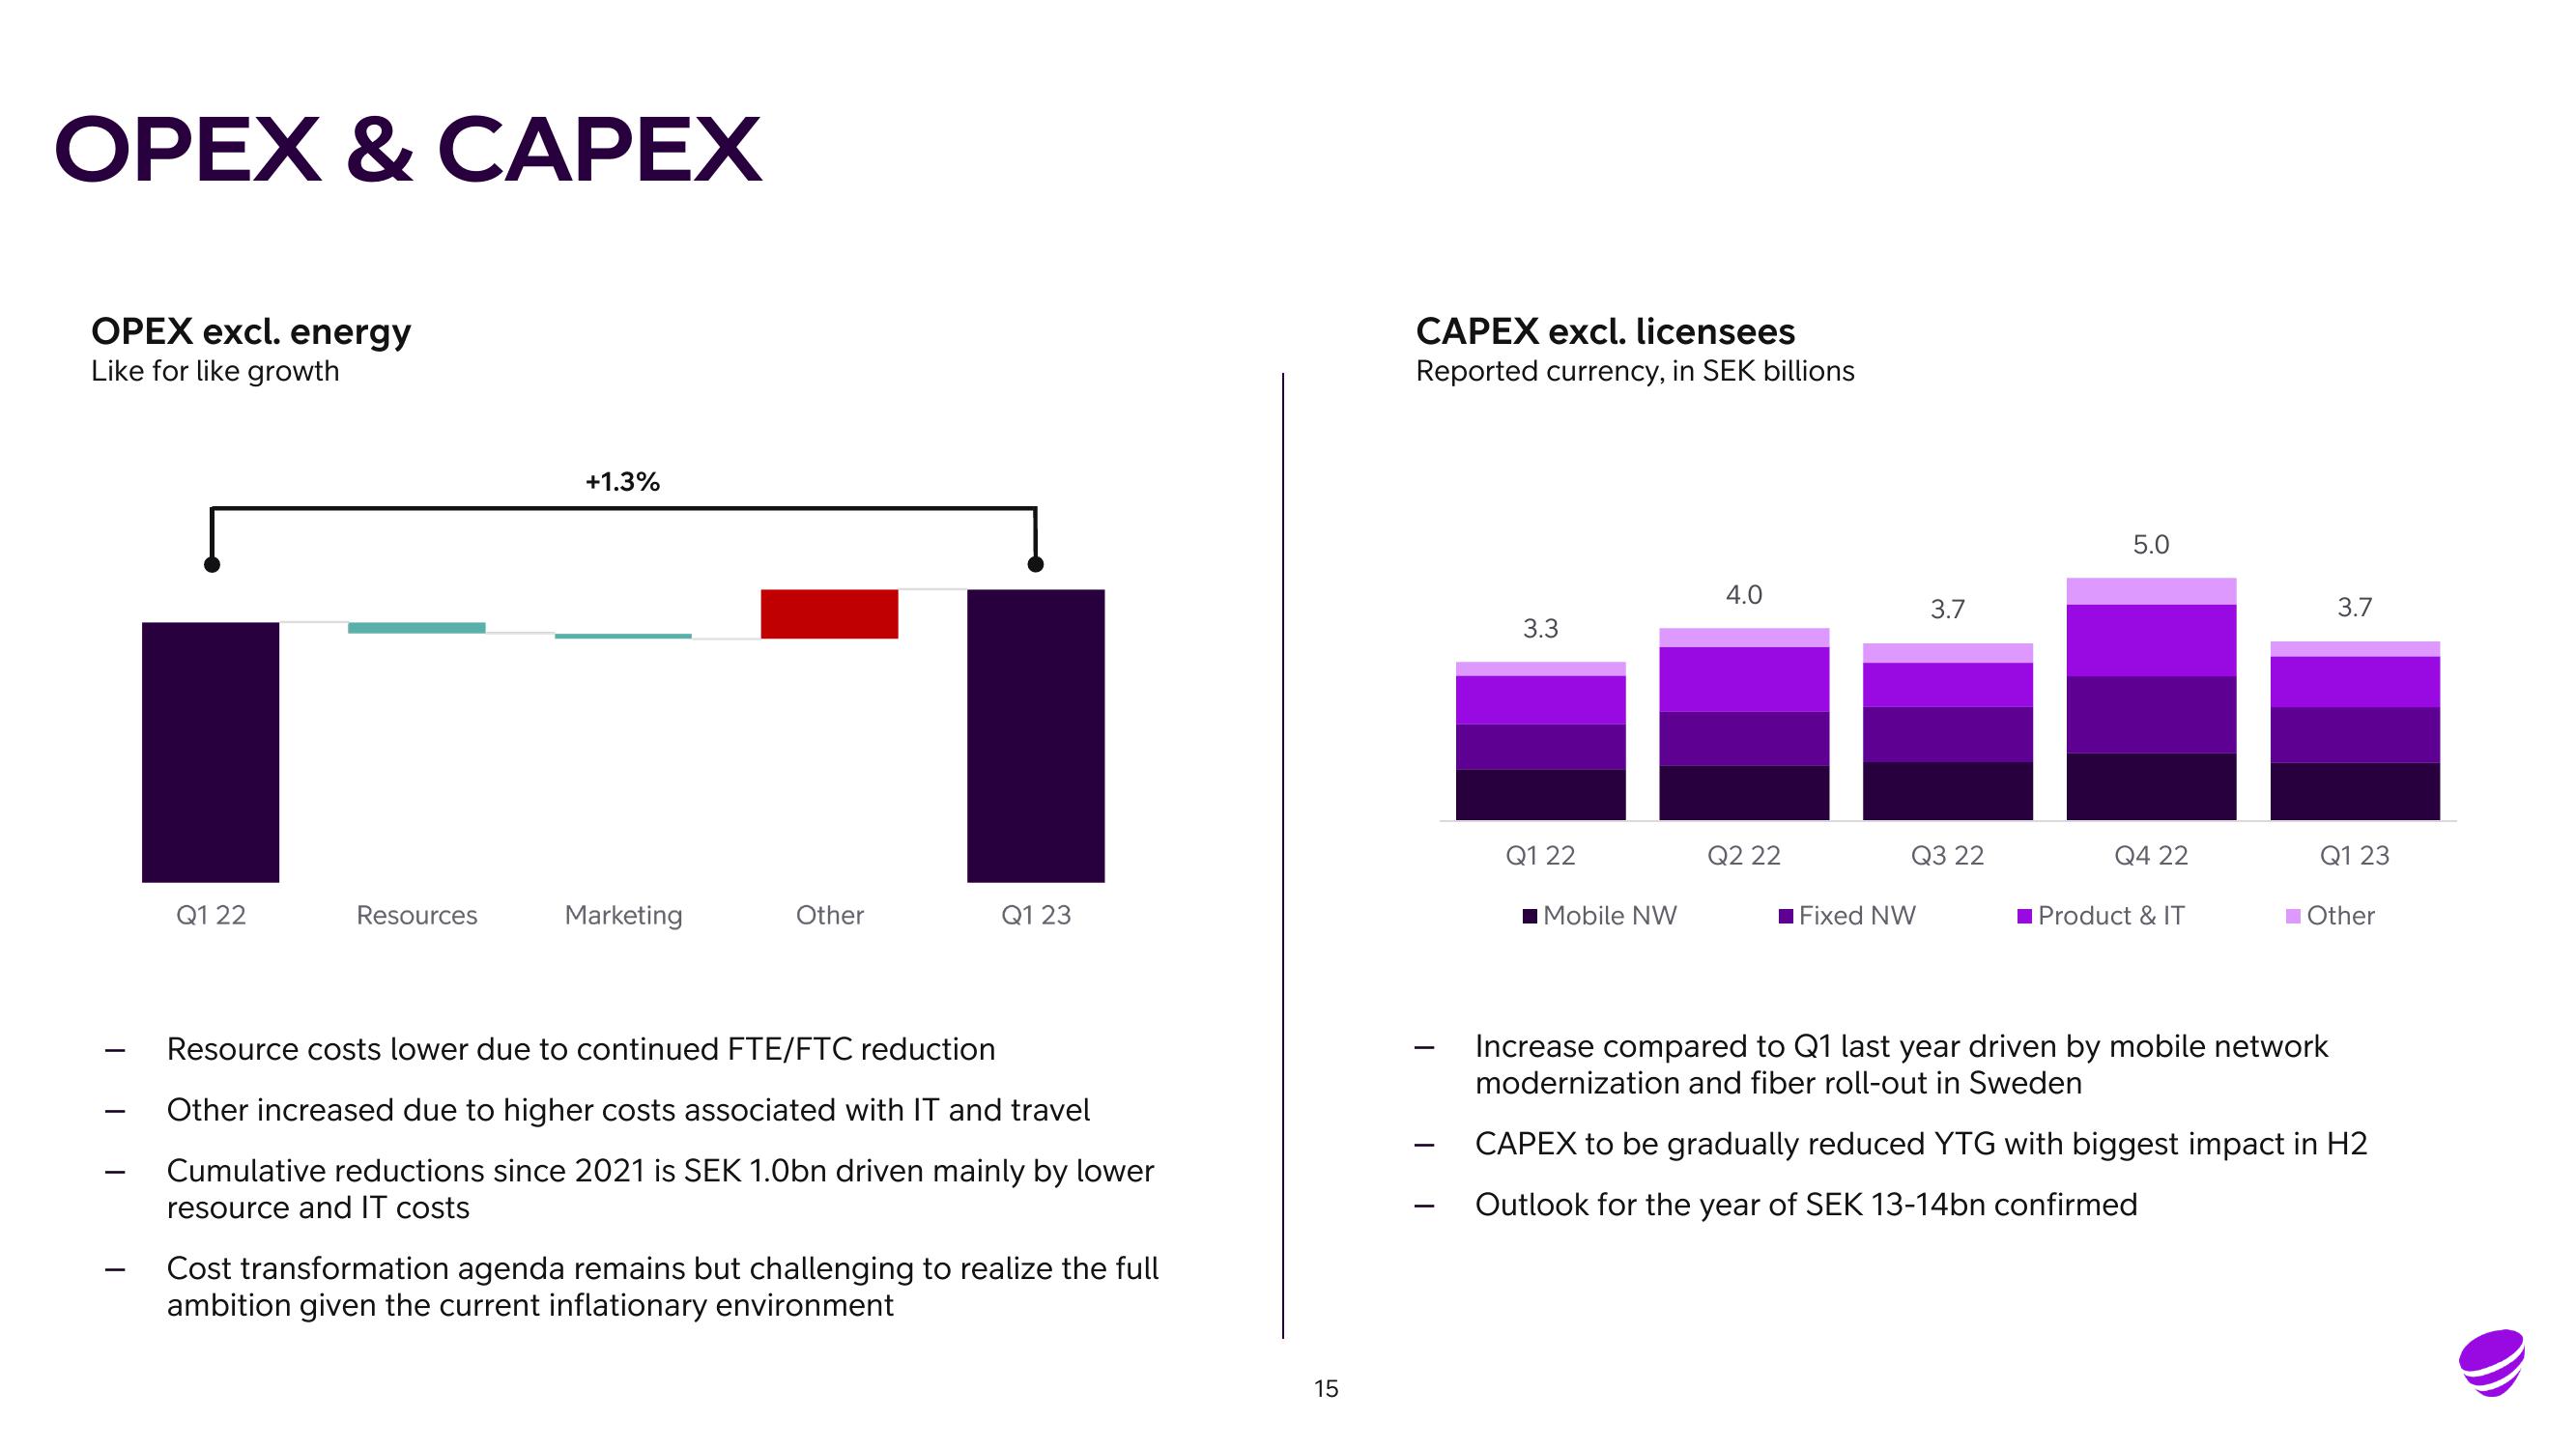
Resource costs lower due to continued FTE/FTC reduction
Other increased due to higher costs associated with IT and travel
Cumulative reductions since 2021 is SEK 1.0bn driven mainly by lower
resource and IT costs
Cost transformation agenda remains but challenging to realize the full
ambition given the current inflationary environment
15
CAPEX excl. licensees
Reported currency, in SEK billions
3.3
Q1 22
■Mobile NW
4.0
Q2 22
3.7
Q3 22
Fixed NW
5.0
Q4 22
Product & IT
3.7
Q1 23
Other
Increase compared to Q1 last year driven by mobile network
modernization and fiber roll-out in Sweden
CAPEX to be gradually reduced YTG with biggest impact in H2
Outlook for the year of SEK 13-14bn confirmedView entire presentation