Grab Results Presentation Deck
Business Update
Improving the health of our marketplace
Continued focus on improving
affordability and efficiency...
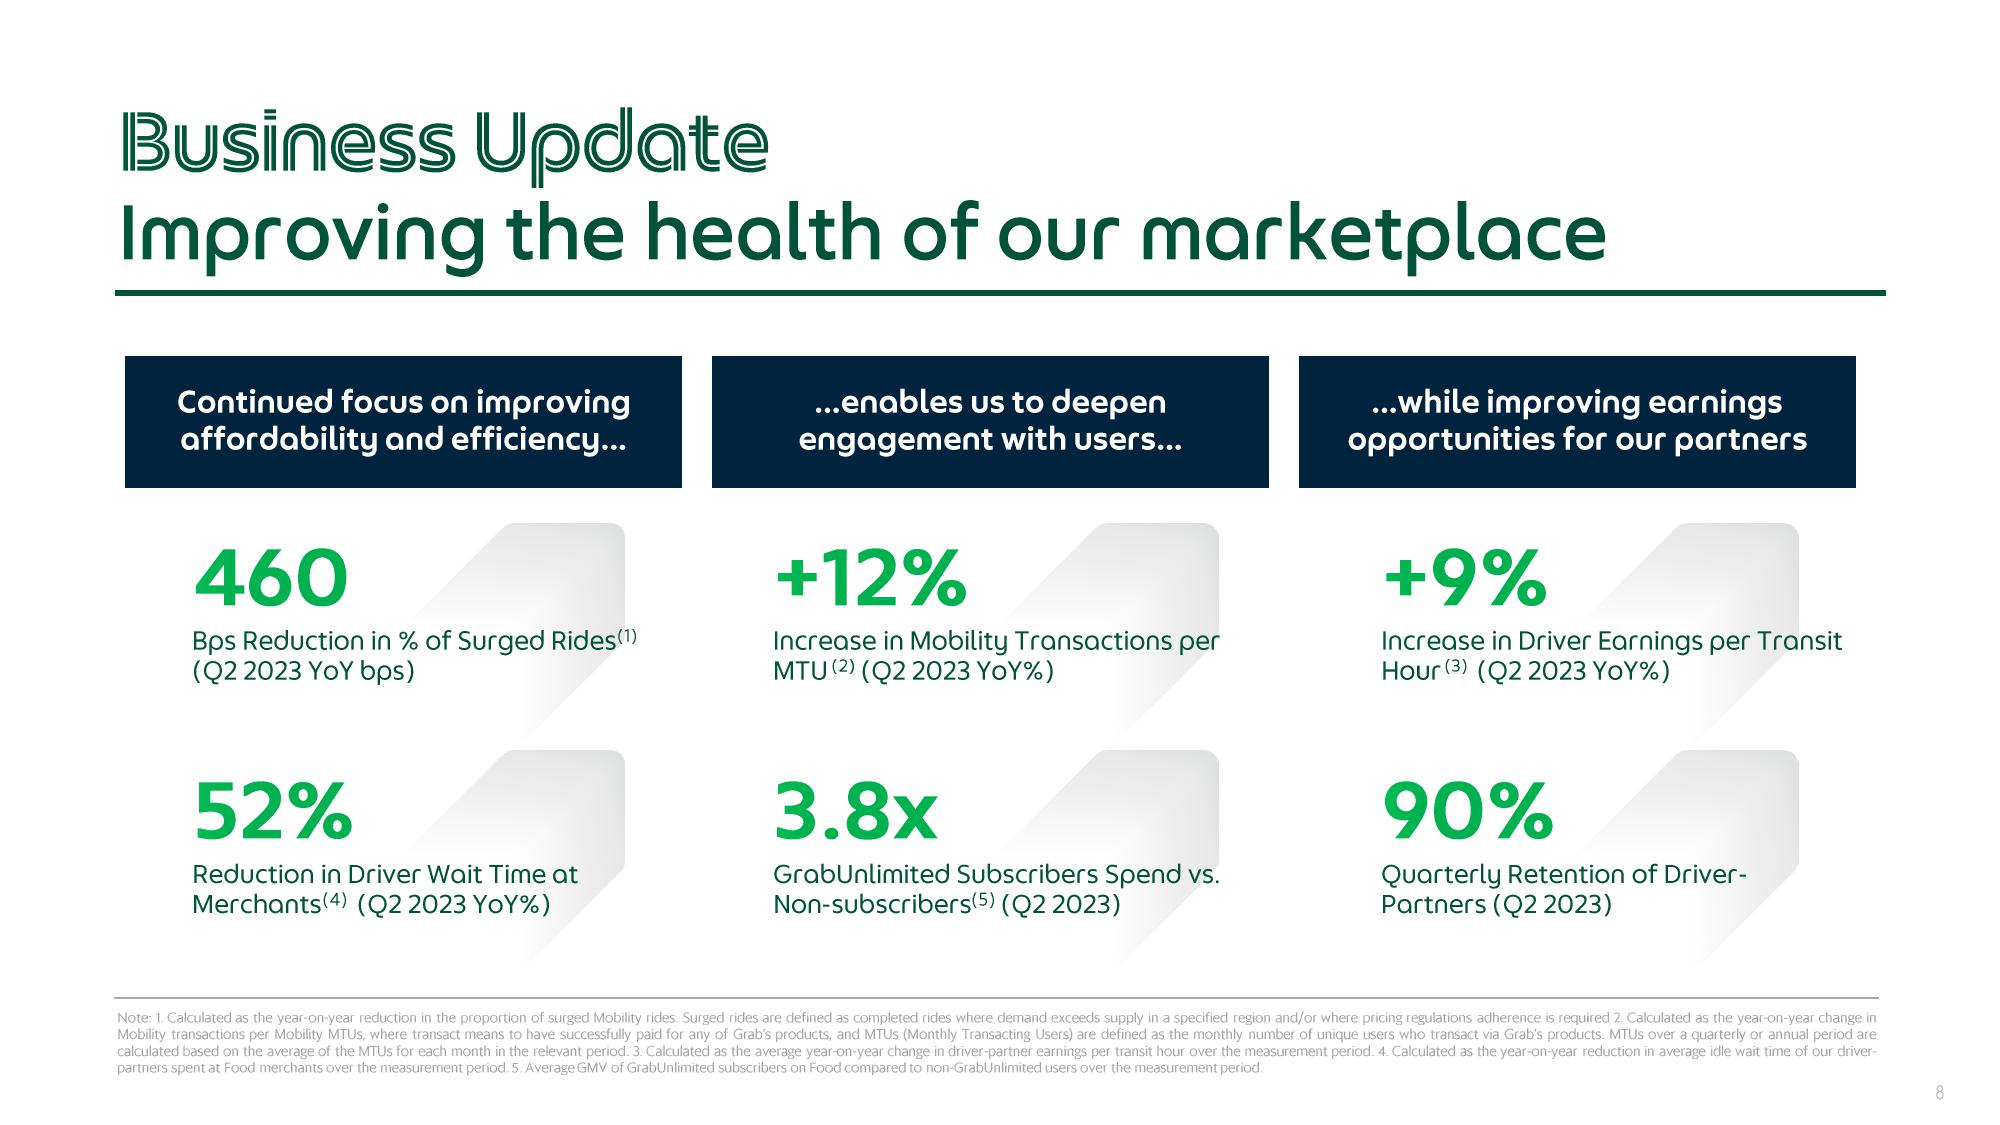
460
Bps Reduction in % of Surged Rides(1)
(Q2 2023 YOY bps)
52%
Reduction in Driver ait Time at
Merchants (4) (Q2 2023 YOY%)
...enables us to deepen
engagement with users...
+12%
Increase in Mobility Transactions per
MTU (2) (Q2 2023 YOY%)
3.8x
GrabUnlimited Subscribers Spend vs.
Non-subscribers(5) (Q2 2023)
...while improving earnings
opportunities for our partners
+9%
Increase in Driver Earnings per Transit
Hour (3) (Q2 2023 YOY%)
90%
Quarterly Retention of Driver-
Partners (Q2 2023)
Note: 1. Calculated as the year-on-year reduction in the proportion of surged Mobility rides. Surged rides are defined as completed rides where demand exceeds supply in a specified region and/or where pricing regulations adherence is required 2. Calculated as the year-on-year change in
Mobility transactions per Mobility MTUS, where transact means to have successfully paid for any of Grab's products, and MTUS (Monthly Transacting Users) are defined as the monthly number of unique users who transact via Grab's products. MTUS over a quarterly or annual period are
calculated based on the average of the MTUs for each month in the relevant period. 3. Calculated as the average year-on-year change in driver-partner earnings per transit hour over the measurement period. 4. Calculated as the year-on-year reduction in average idle wait time of our driver-
partners spent at Food merchants over the measurement period. 5. Average GMV of GrabUnlimited subscribers on Food compared to non-GrabUnlimited users over the measurement period.
8View entire presentation