Flutter Results Presentation Deck
Financial Review
Statutory Group Income Statement¹
£m
Revenue
Gross profit
EBITDA
Overview
Depreciation & amortisation
Amortisation of acquired intangibles
Gain on disposal
Operating profit
Net interest expense
Profit/(loss) before tax
Taxation
Profit/(loss) after tax
H1 2023
4,809
2,801
765
(238)
(314)
214
(131)
83
45
128
H1 2022
3,388
2,036
434
(145)
(286)
2
5
(57)
(51)
(61)
(112)
YOY
+42%
+38%
+76%
+64%
+10%
+3,865%
+131%
¹ Variances between statutory P&L and metrics on slide 9 relate to adjusting (i) for Sisal on a pro forma basis, (ii) to reflect growth
rates in constant currency terms and (iii) to include SDIS
2 SDIS relate to separately disclosed items, not considered part of the normal business activity of the Group
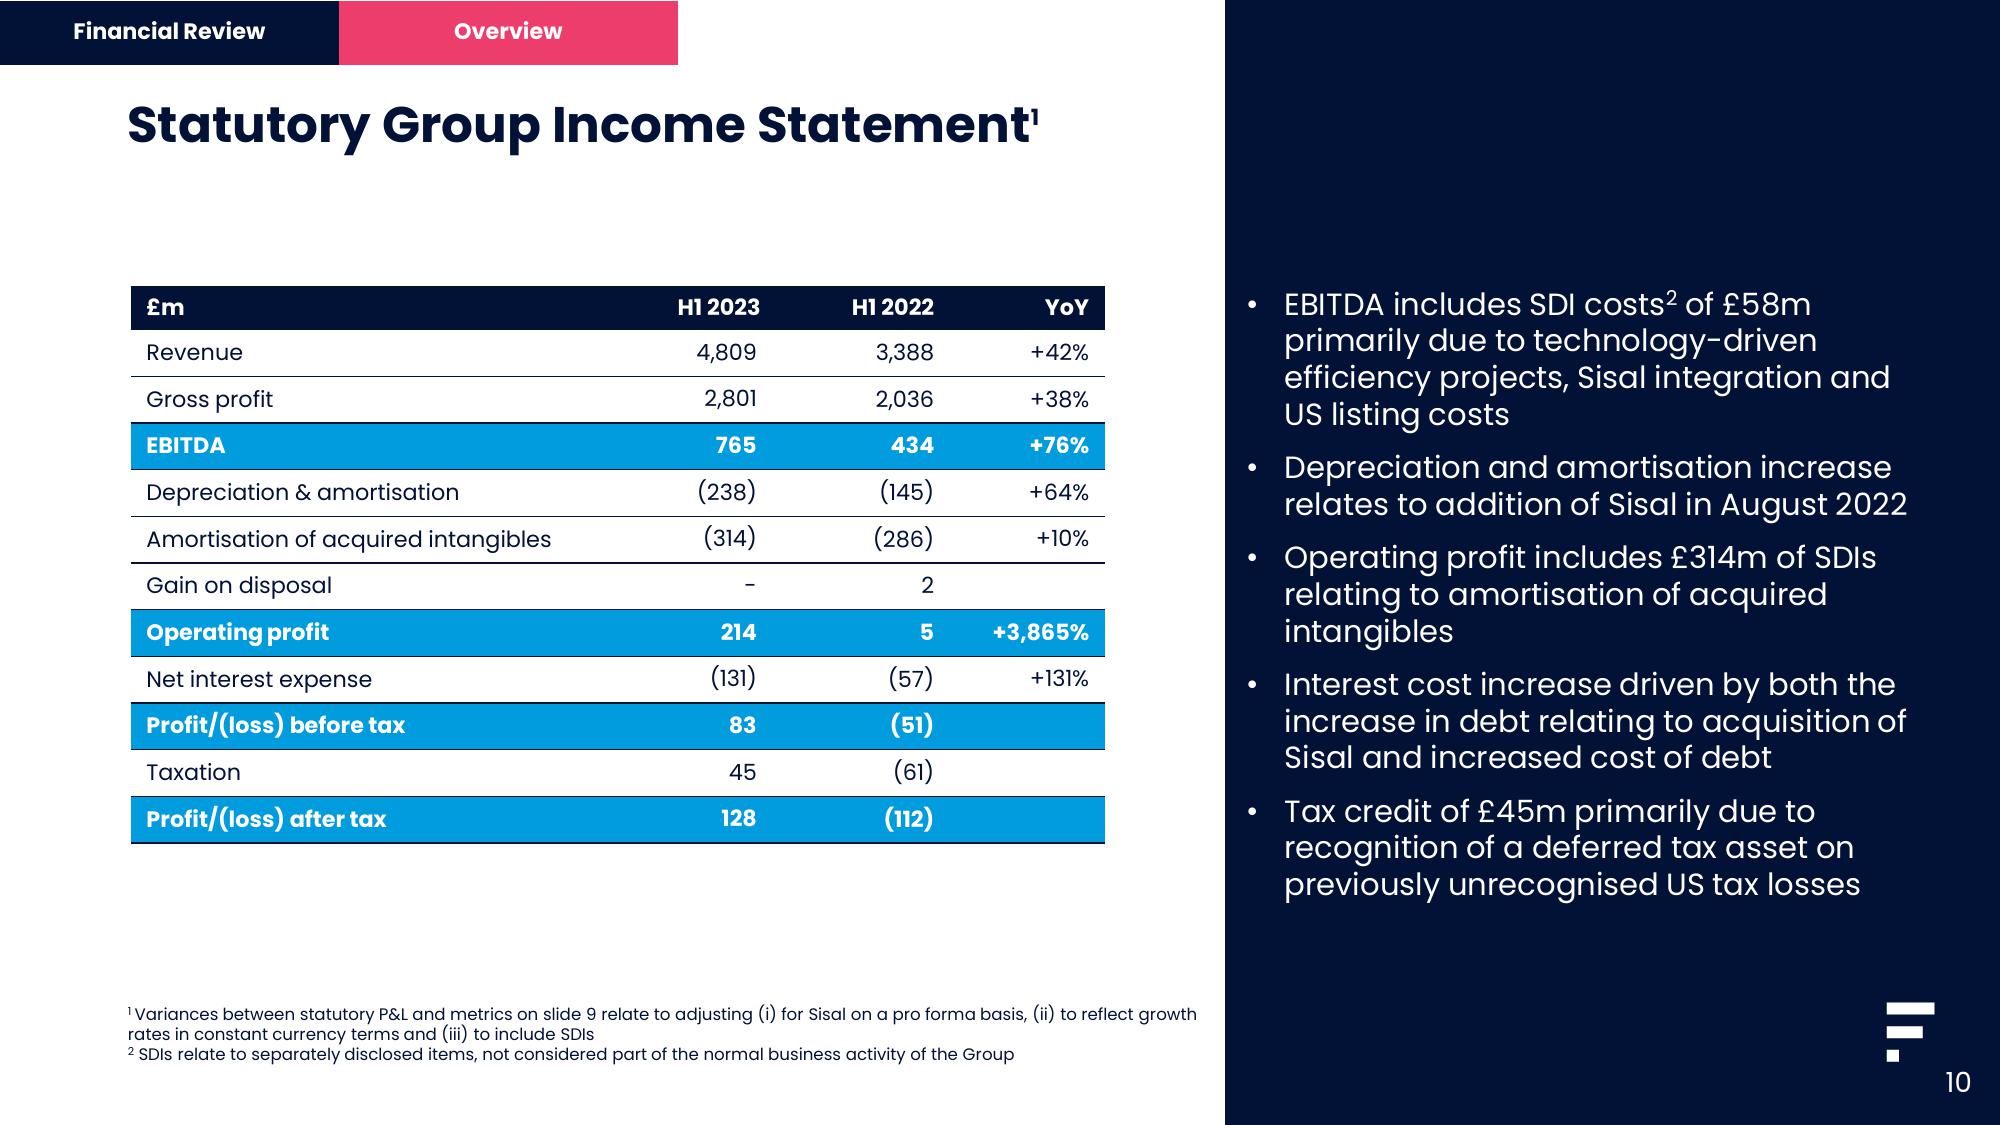
EBITDA includes SDI costs² of £58m
primarily due to technology-driven
efficiency projects, Sisal integration and
US listing costs
Depreciation and amortisation increase
relates to addition of Sisal in August 2022
Operating profit includes £314m of SDIS
relating to amortisation of acquired
intangibles
Interest cost increase driven by both the
increase in debt relating to acquisition of
Sisal and increased cost of debt
Tax credit of £45m primarily due to
recognition of a deferred tax asset on
previously unrecognised US tax losses
II.
10View entire presentation