OpenText Investor Presentation Deck
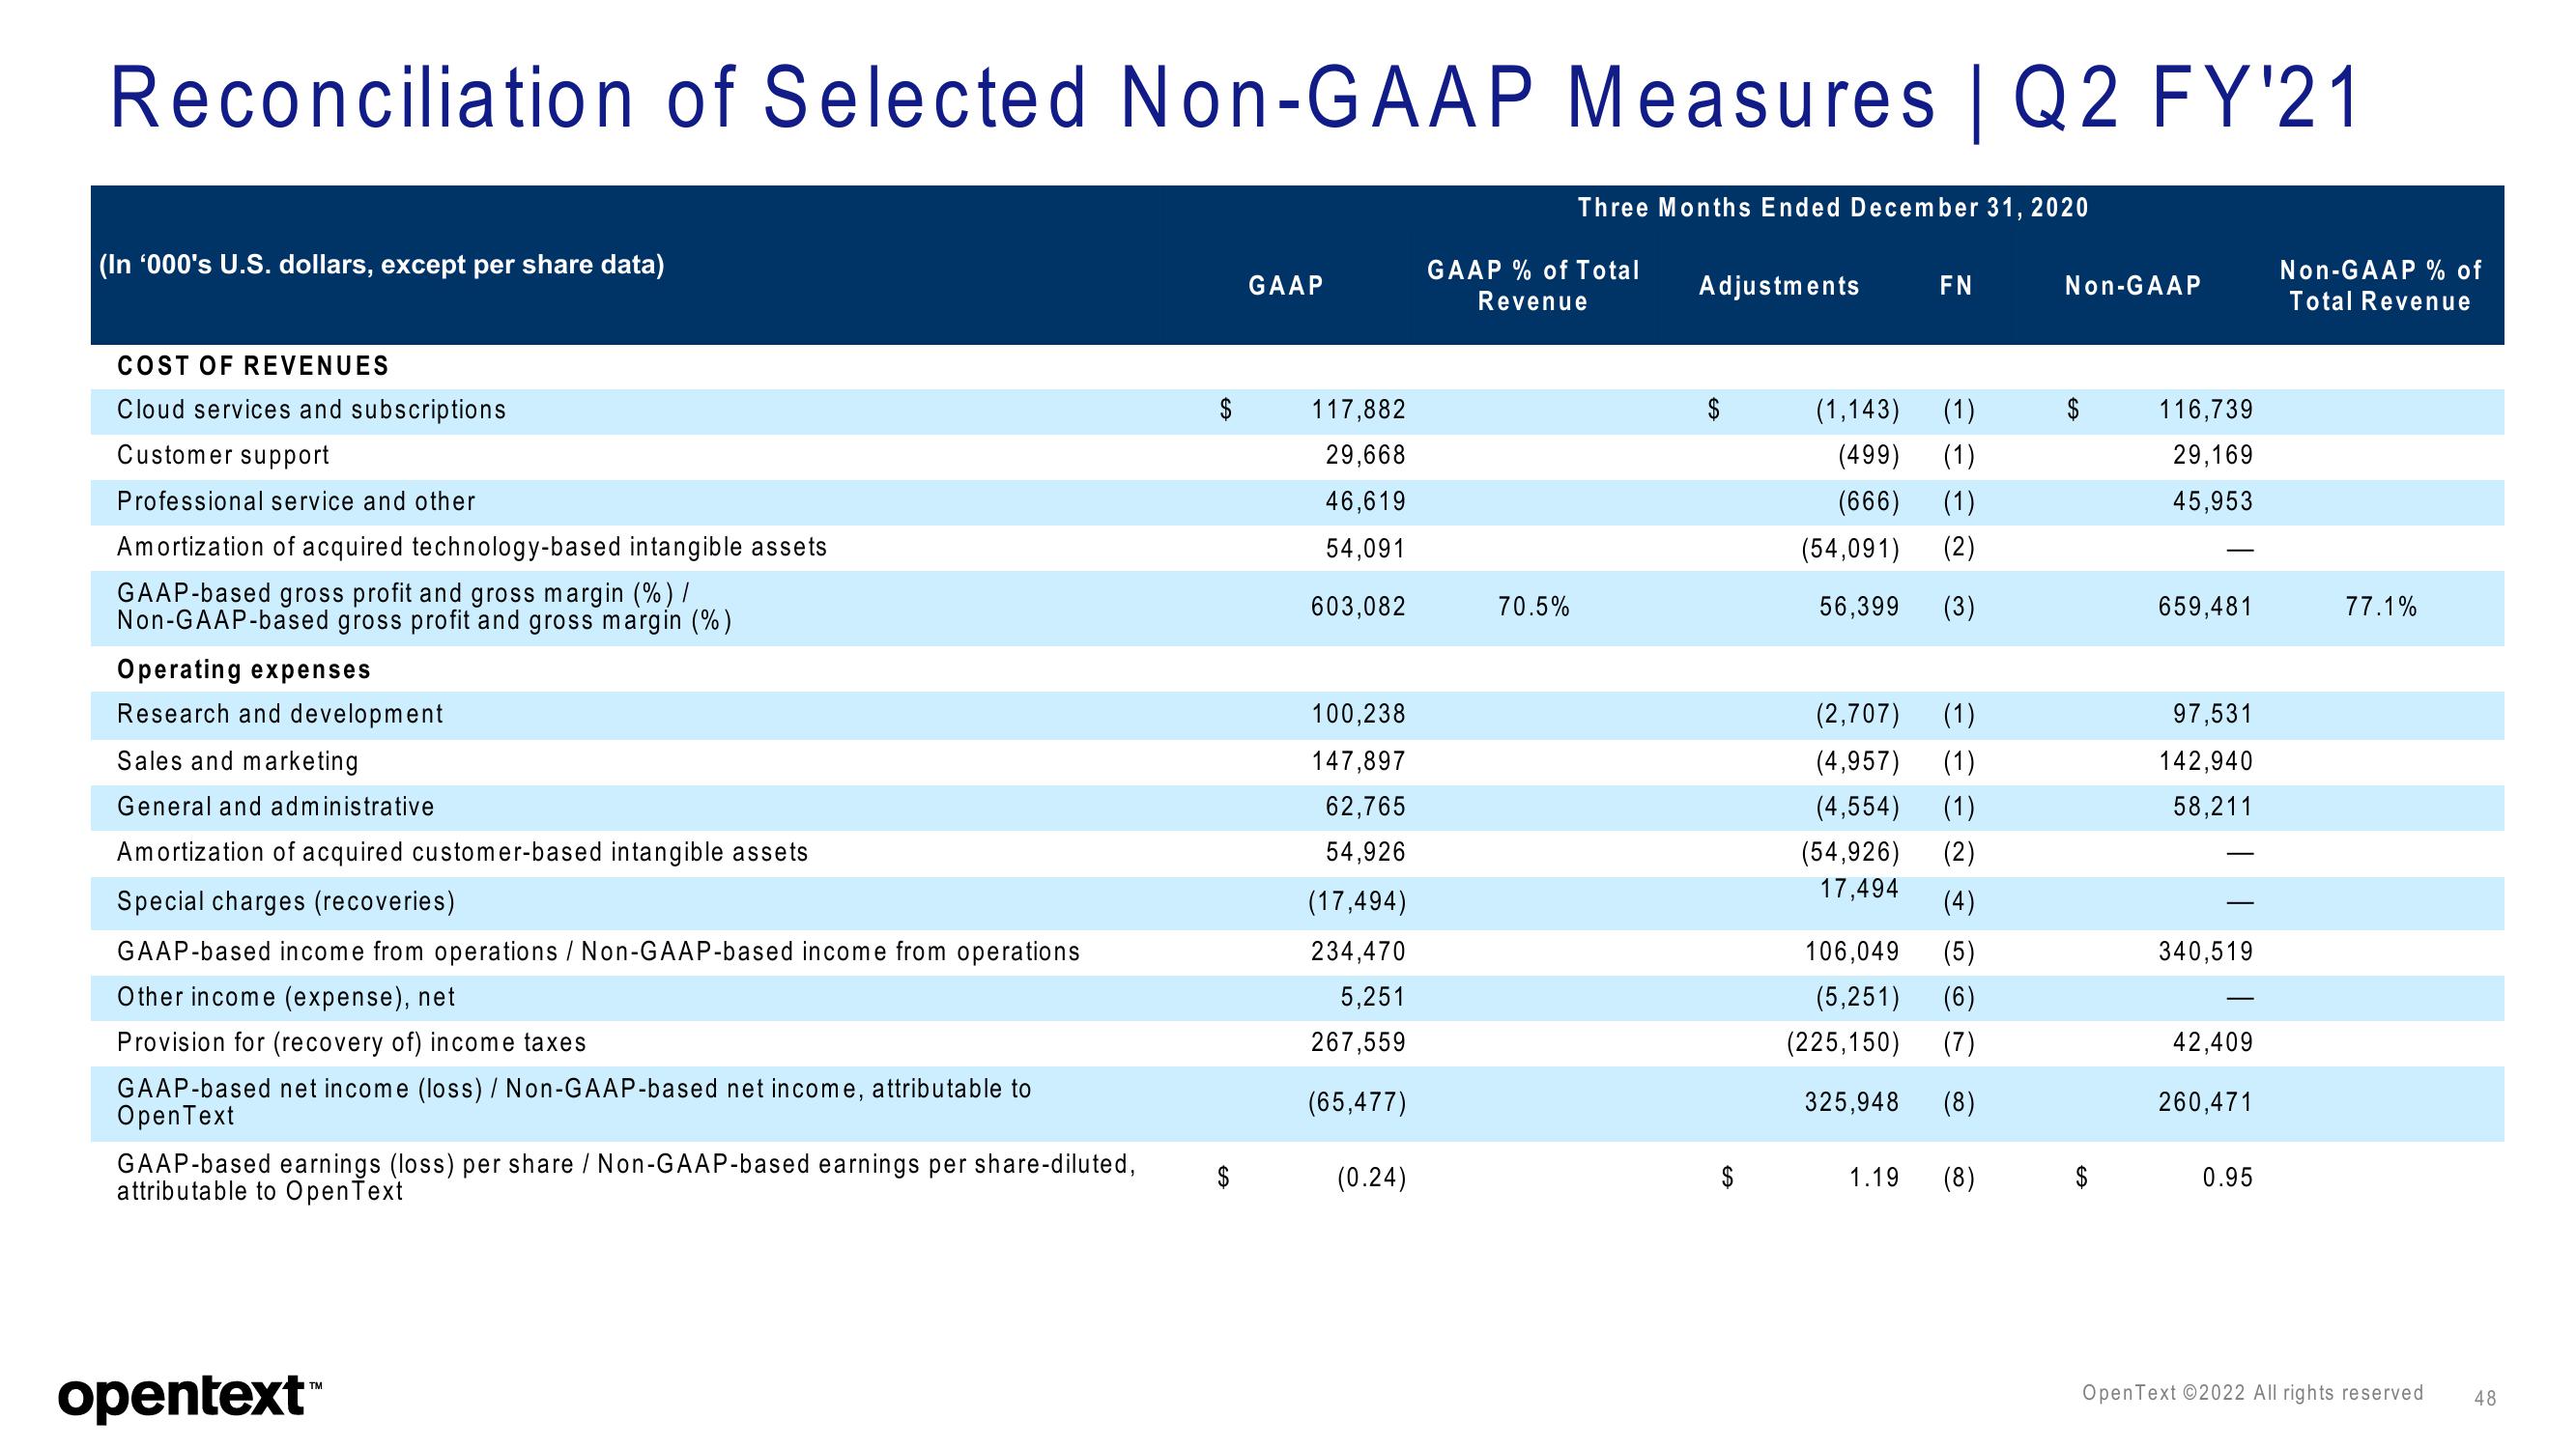
Reconciliation of Selected Non-GAAP Measures | Q2 FY'21
(In '000's U.S. dollars, except per share data)
COST OF REVENUES
Cloud services and subscriptions
Customer support
Professional service and other
Amortization of acquired technology-based intangible assets
GAAP-based gross profit and gross margin (%) /
Non-GAAP-based gross profit and gross margin (%)
Operating expenses
Research and development
Sales and marketing
General and administrative
Amortization of acquired customer-based intangible assets
Special charges (recoveries)
GAAP-based income from operations / Non-GAAP-based income from operations
Other income (expense), net
Provision for (recovery of) income taxes
GAAP-based net income (loss) / Non-GAAP-based net income, attributable to
OpenText
GAAP-based earnings (loss) per share / Non-GAAP-based earnings per share-diluted,
attributable to OpenText
opentext™
SA
GAAP
117,882
29,668
46,619
54,091
603,082
100,238
147,897
62,765
54,926
(17,494)
234,470
5,251
267,559
(65,477)
(0.24)
Three Months Ended December 31, 2020
GAAP % of Total
Revenue
70.5%
Adjustments
$
(1,143)
(499)
(666)
(54,091)
(1)
(1)
(1)
(2)
56,399 (3)
FN
(2,707) (1)
(4,957) (1)
(4,554) (1)
(54,926) (2)
17,494
(4)
106,049 (5)
(5,251) (6)
(225,150) (7)
325,948
(8)
1.19
(8)
Non-GAAP
116,739
29,169
45,953
659,481
97,531
142,940
58,211
340,519
42,409
260,471
0.95
Non-GAAP % of
Total Revenue
77.1%
Open Text ©2022 All rights reserved
48View entire presentation