Flutter Results Presentation Deck
Sustainable revenue growth
+ margin benefits
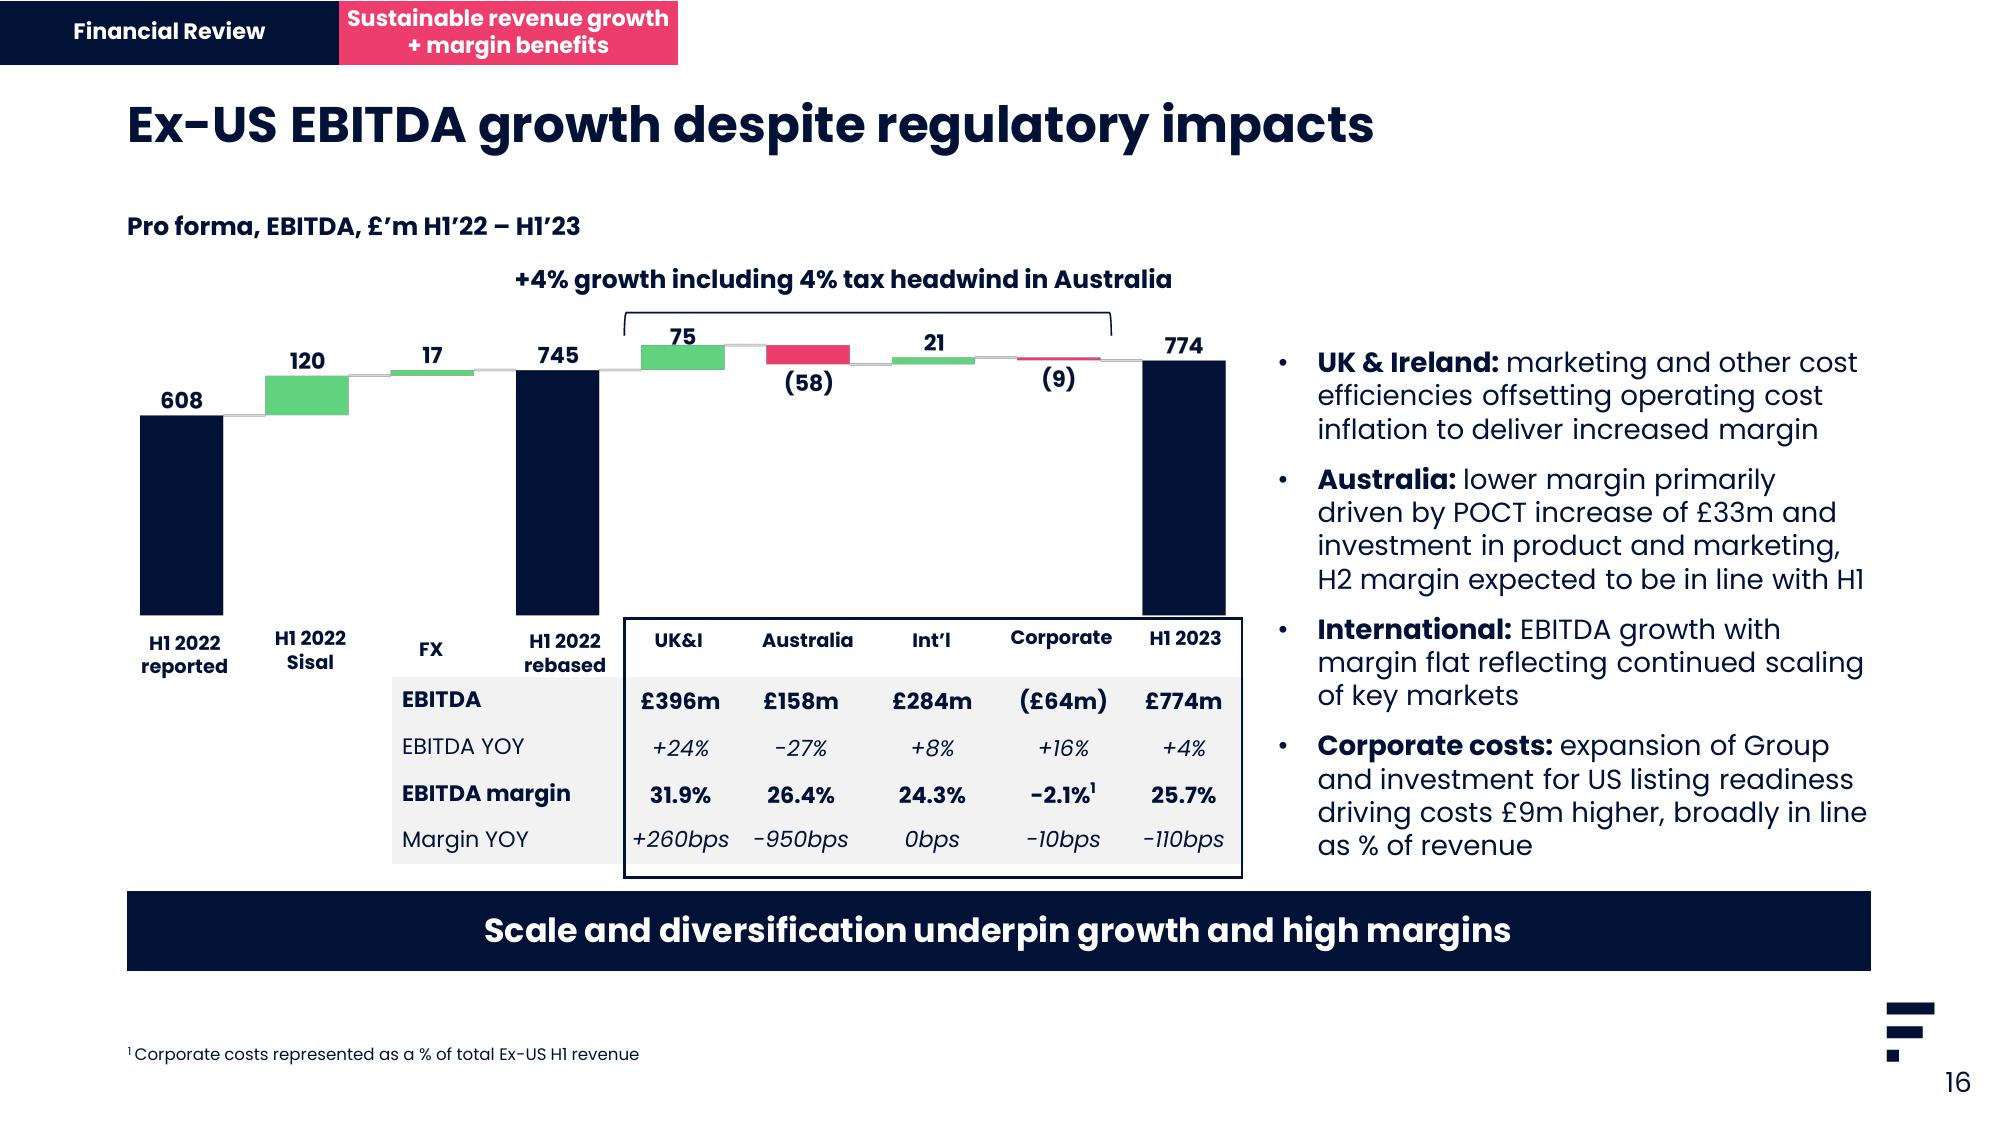
Ex-US EBITDA growth despite regulatory impacts
Financial Review
Pro forma, EBITDA, £'m H1'22 - H1'23
608
H1 2022
reported
120
H12022
Sisal
17
FX
+4% growth including 4% tax headwind in Australia
745
H1 2022
rebased
EBITDA
EBITDA YOY
EBITDA margin
Margin YOY
75
¹Corporate costs represented as a % of total Ex-US H1 revenue
UK&I
(58)
Australia
21
Int'l
(9)
Corporate
774
H1 2023
(£64m)
+16%
-2.1%¹ 25.7%
-10bps -110bps
£774m
●
+4%
●
●
£396m £158m
+24%
-27%
£284m
+8%
31.9% 26.4% 24.3%
+260bps -950bps Obps
Scale and diversification underpin growth and high margins
UK & Ireland: marketing and other cost
efficiencies offsetting operating cost
inflation to deliver increased margin
Australia: lower margin primarily
driven by POCT increase of £33m and
investment in product and marketing,
H2 margin expected to be in line with HI
International: EBITDA growth with
margin flat reflecting continued scaling
of key markets
Corporate costs: expansion of Group
and investment for US listing readiness
driving costs £9m higher, broadly in line
as % of revenue
F
II.
16View entire presentation