Grab Results Presentation Deck
Financial Services
Key focus areas
$
Continue to
drive usage
and adoption
Focus on
new growth
initiatives
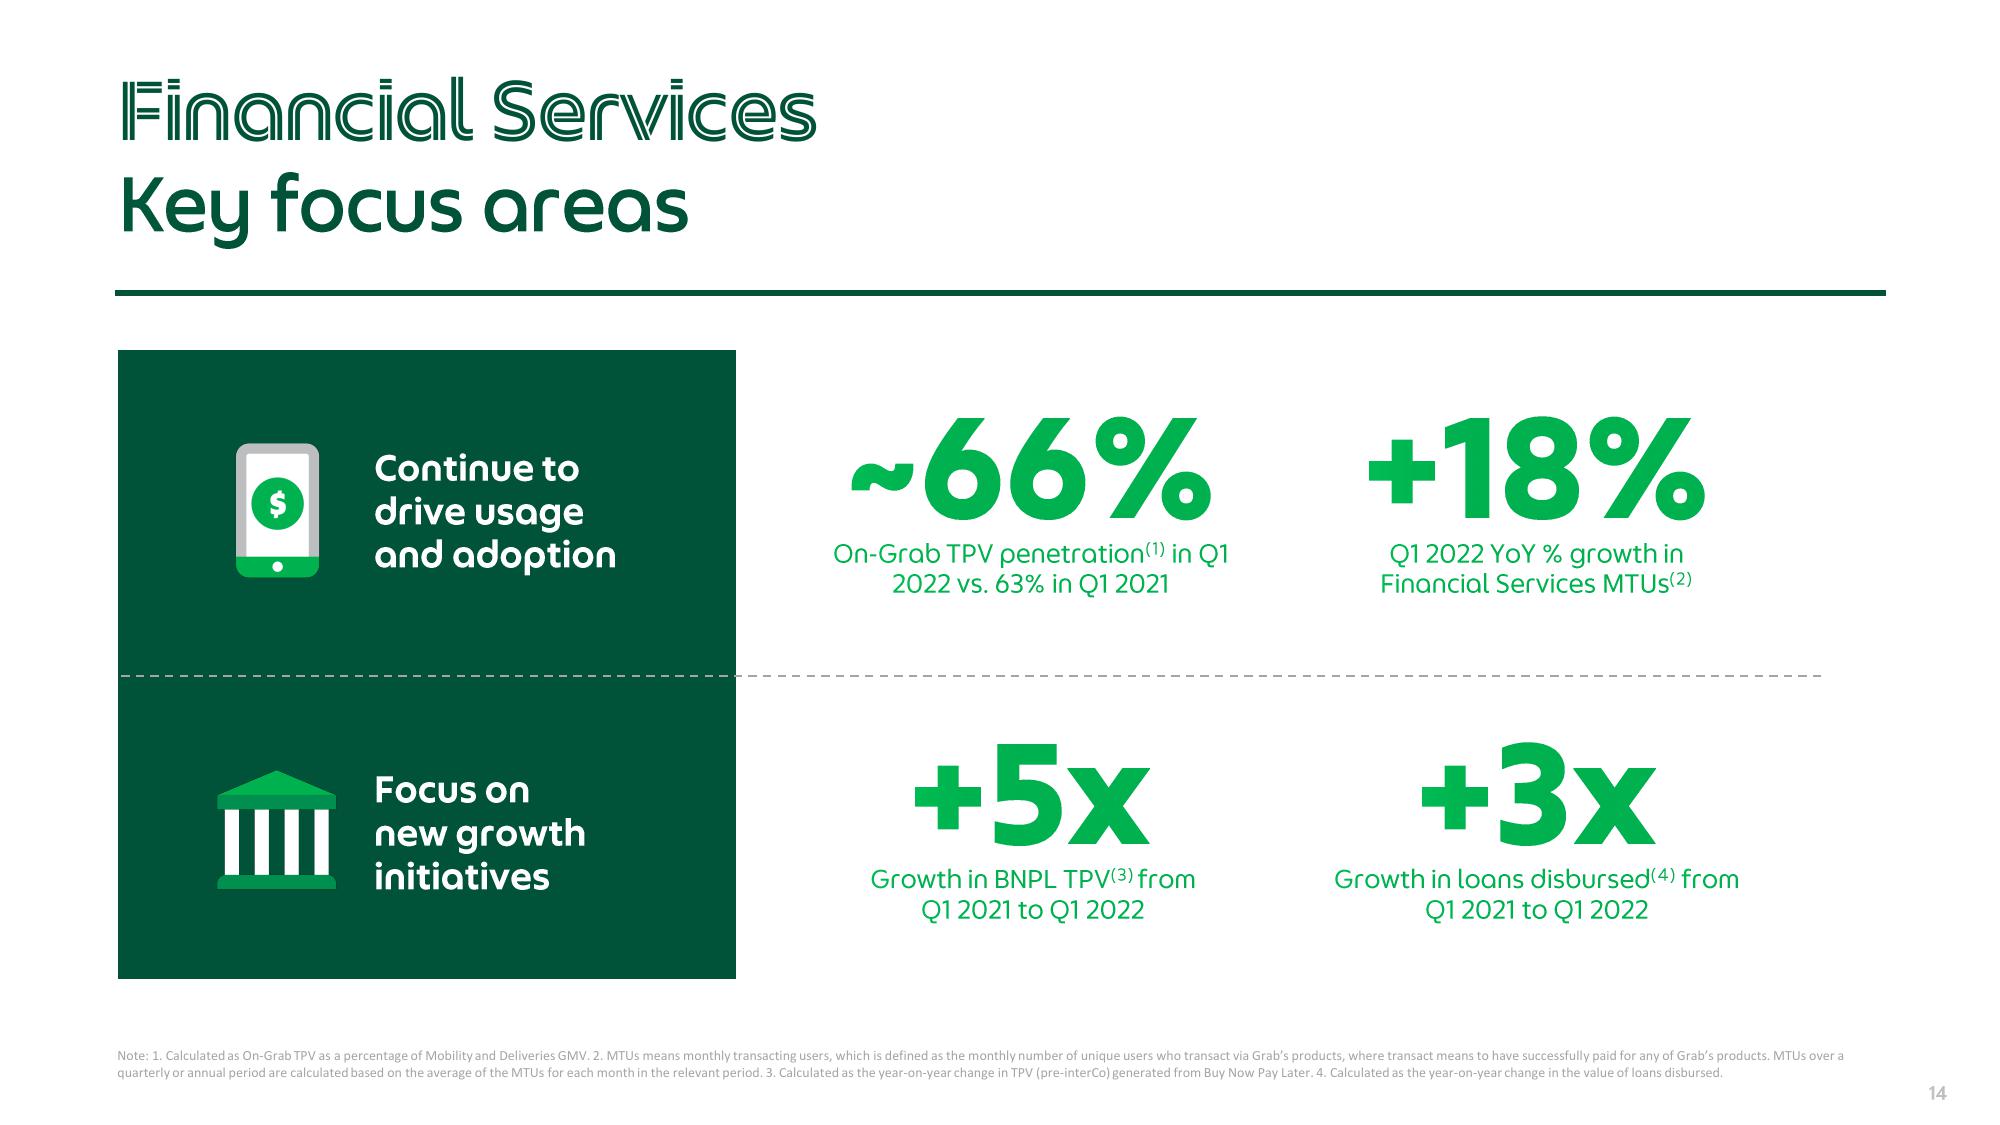
~66%
On-Grab TPV penetration (1) in Q1
2022 vs. 63% in Q1 2021
+5x
Growth in BNPL TPV(3) from
Q1 2021 to Q1 2022
+18%
Q1 2022 YOY % growth in
Financial Services MTUS(2)
+3x
Growth in loans disbursed(4) from
Q1 2021 to Q1 2022
Note: 1. Calculated as On-Grab TPV as a percentage of Mobility and Deliveries GMV. 2. MTUS means monthly transacting users, which is defined as the monthly number of unique users who transact via Grab's products, where transact means to have successfully paid for any of Grab's products. MTUs over a
quarterly or annual period are calculated based on the average of the MTUs for each month in the relevant period. 3. Calculated as the year-on-year change in TPV (pre-interCo) generated from Buy Now Pay Later. 4. Calculated as the year-on-year change in the value of loans disbursed.
14View entire presentation