Flutter Results Presentation Deck
Sustainable revenue growth
+ margin benefits
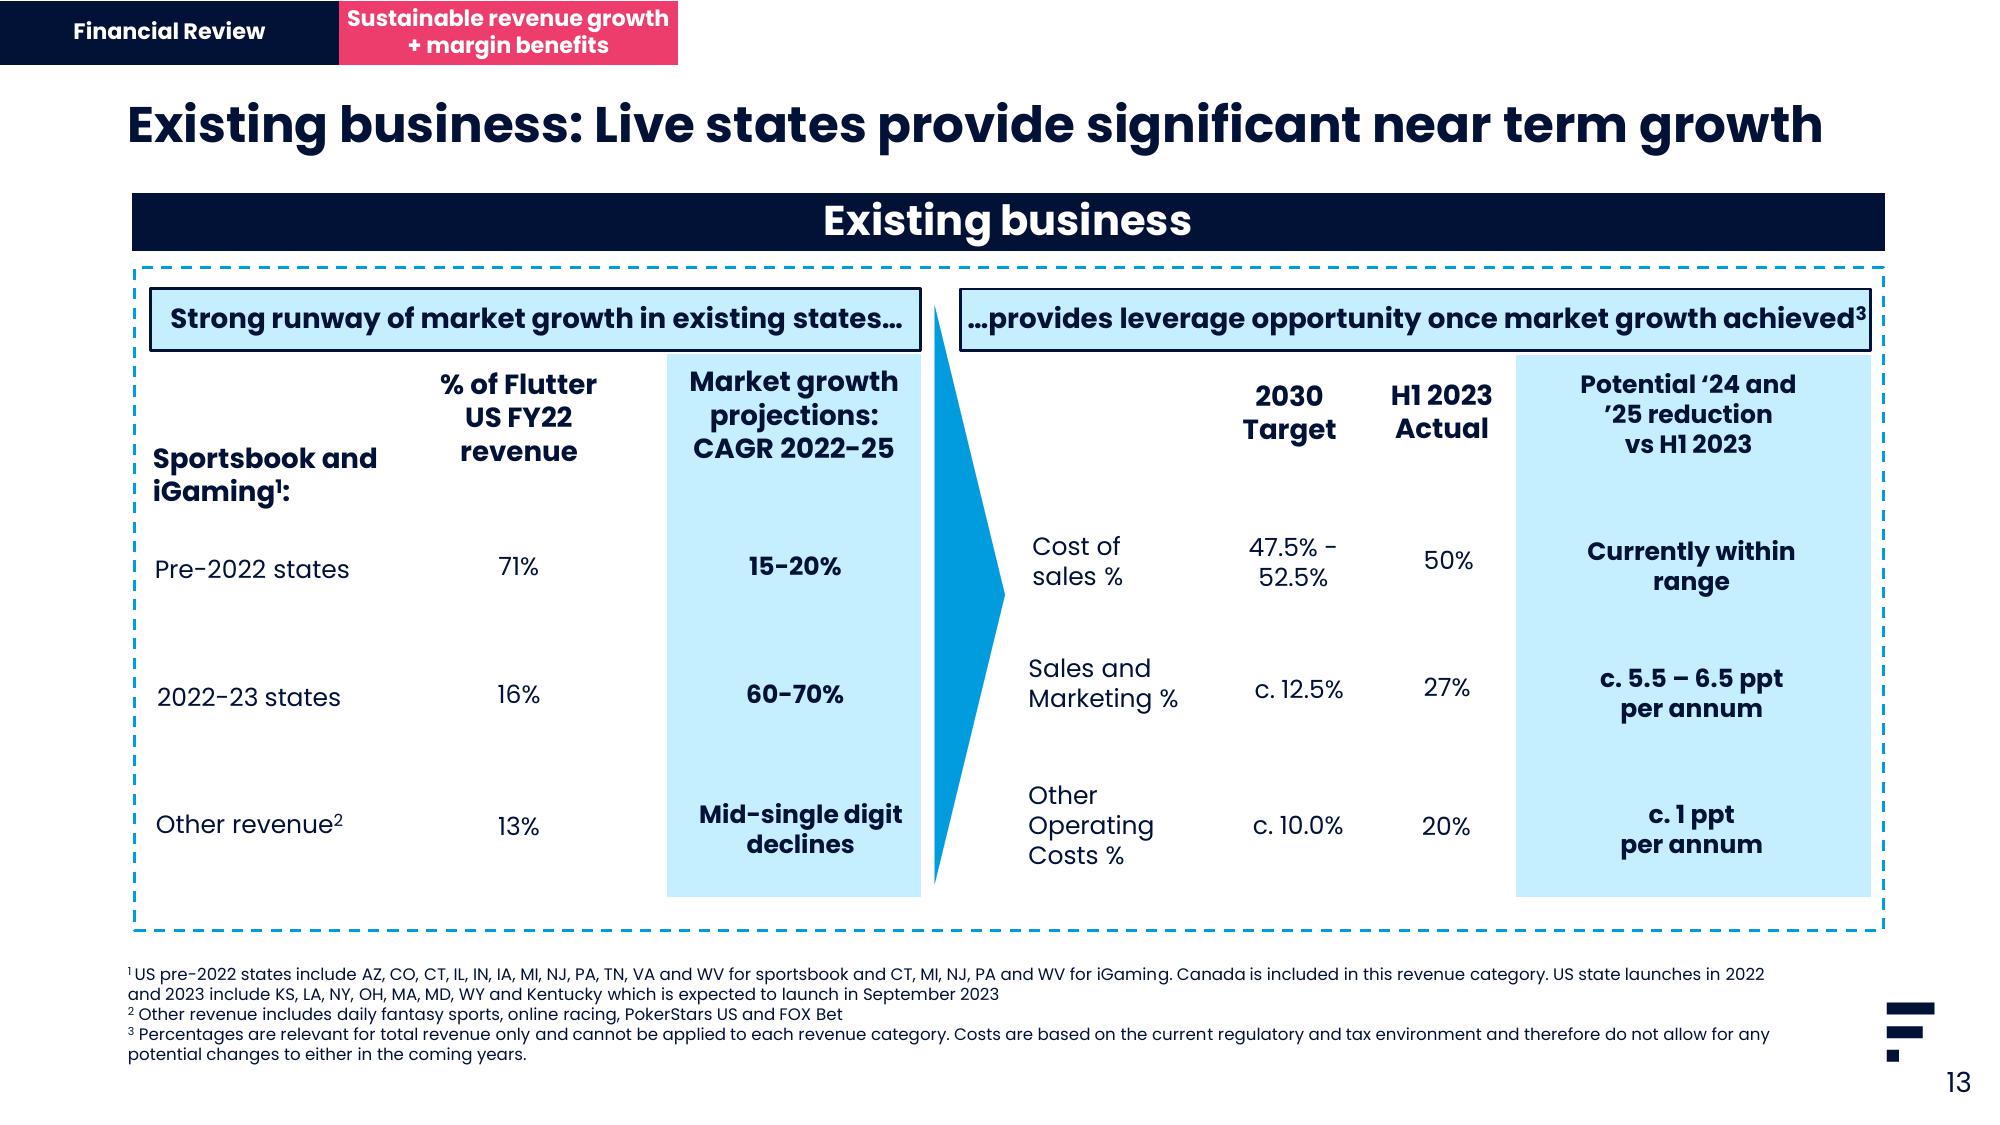
Existing business: Live states provide significant near term growth
Existing business
Financial Review
I
I
I
1
I
I
I
J
I
I
I
I
I
I
I
I
I
I
Strong runway of market growth in existing states...
% of Flutter
US FY22
Market growth
projections:
CAGR 2022-25
revenue
Sportsbook and
iGaming¹:
Pre-2022 states
2022-23 states
Other revenue²
71%
16%
13%
15-20%
60-70%
Mid-single digit
declines
...provides leverage opportunity once market growth achieved ³
Potential '24 and
'25 reduction
vs H1 2023
Cost of
sales %
Sales and
Marketing %
Other
Operating
Costs %
2030
Target
47.5% -
52.5%
c. 12.5%
c. 10.0%
Hồ 2023
Actual
50%
27%
20%
Currently within
range
c. 5.5-6.5 ppt
per annum
c.1ppt
per annum
¹US pre-2022 states include AZ, CO, CT, IL, IN, IA, MI, NJ, PA, TN, VA and WV for sportsbook and CT, MI, NJ, PA and WV for iGaming. Canada is included in this revenue category. US state launches in 2022
and 2023 include KS, LA, NY, OH, MA, MD, WY and Kentucky which is expected to launch in September 2023
2 Other revenue includes daily fantasy sports, online racing, PokerStars US and FOX Bet
3 Percentages are relevant for total revenue only and cannot be applied to each revenue category. Costs are based on the current regulatory and tax environment and therefore do not allow for any
potential changes to either in the coming years.
II.
13View entire presentation