Palantir Results Presentation Deck
9
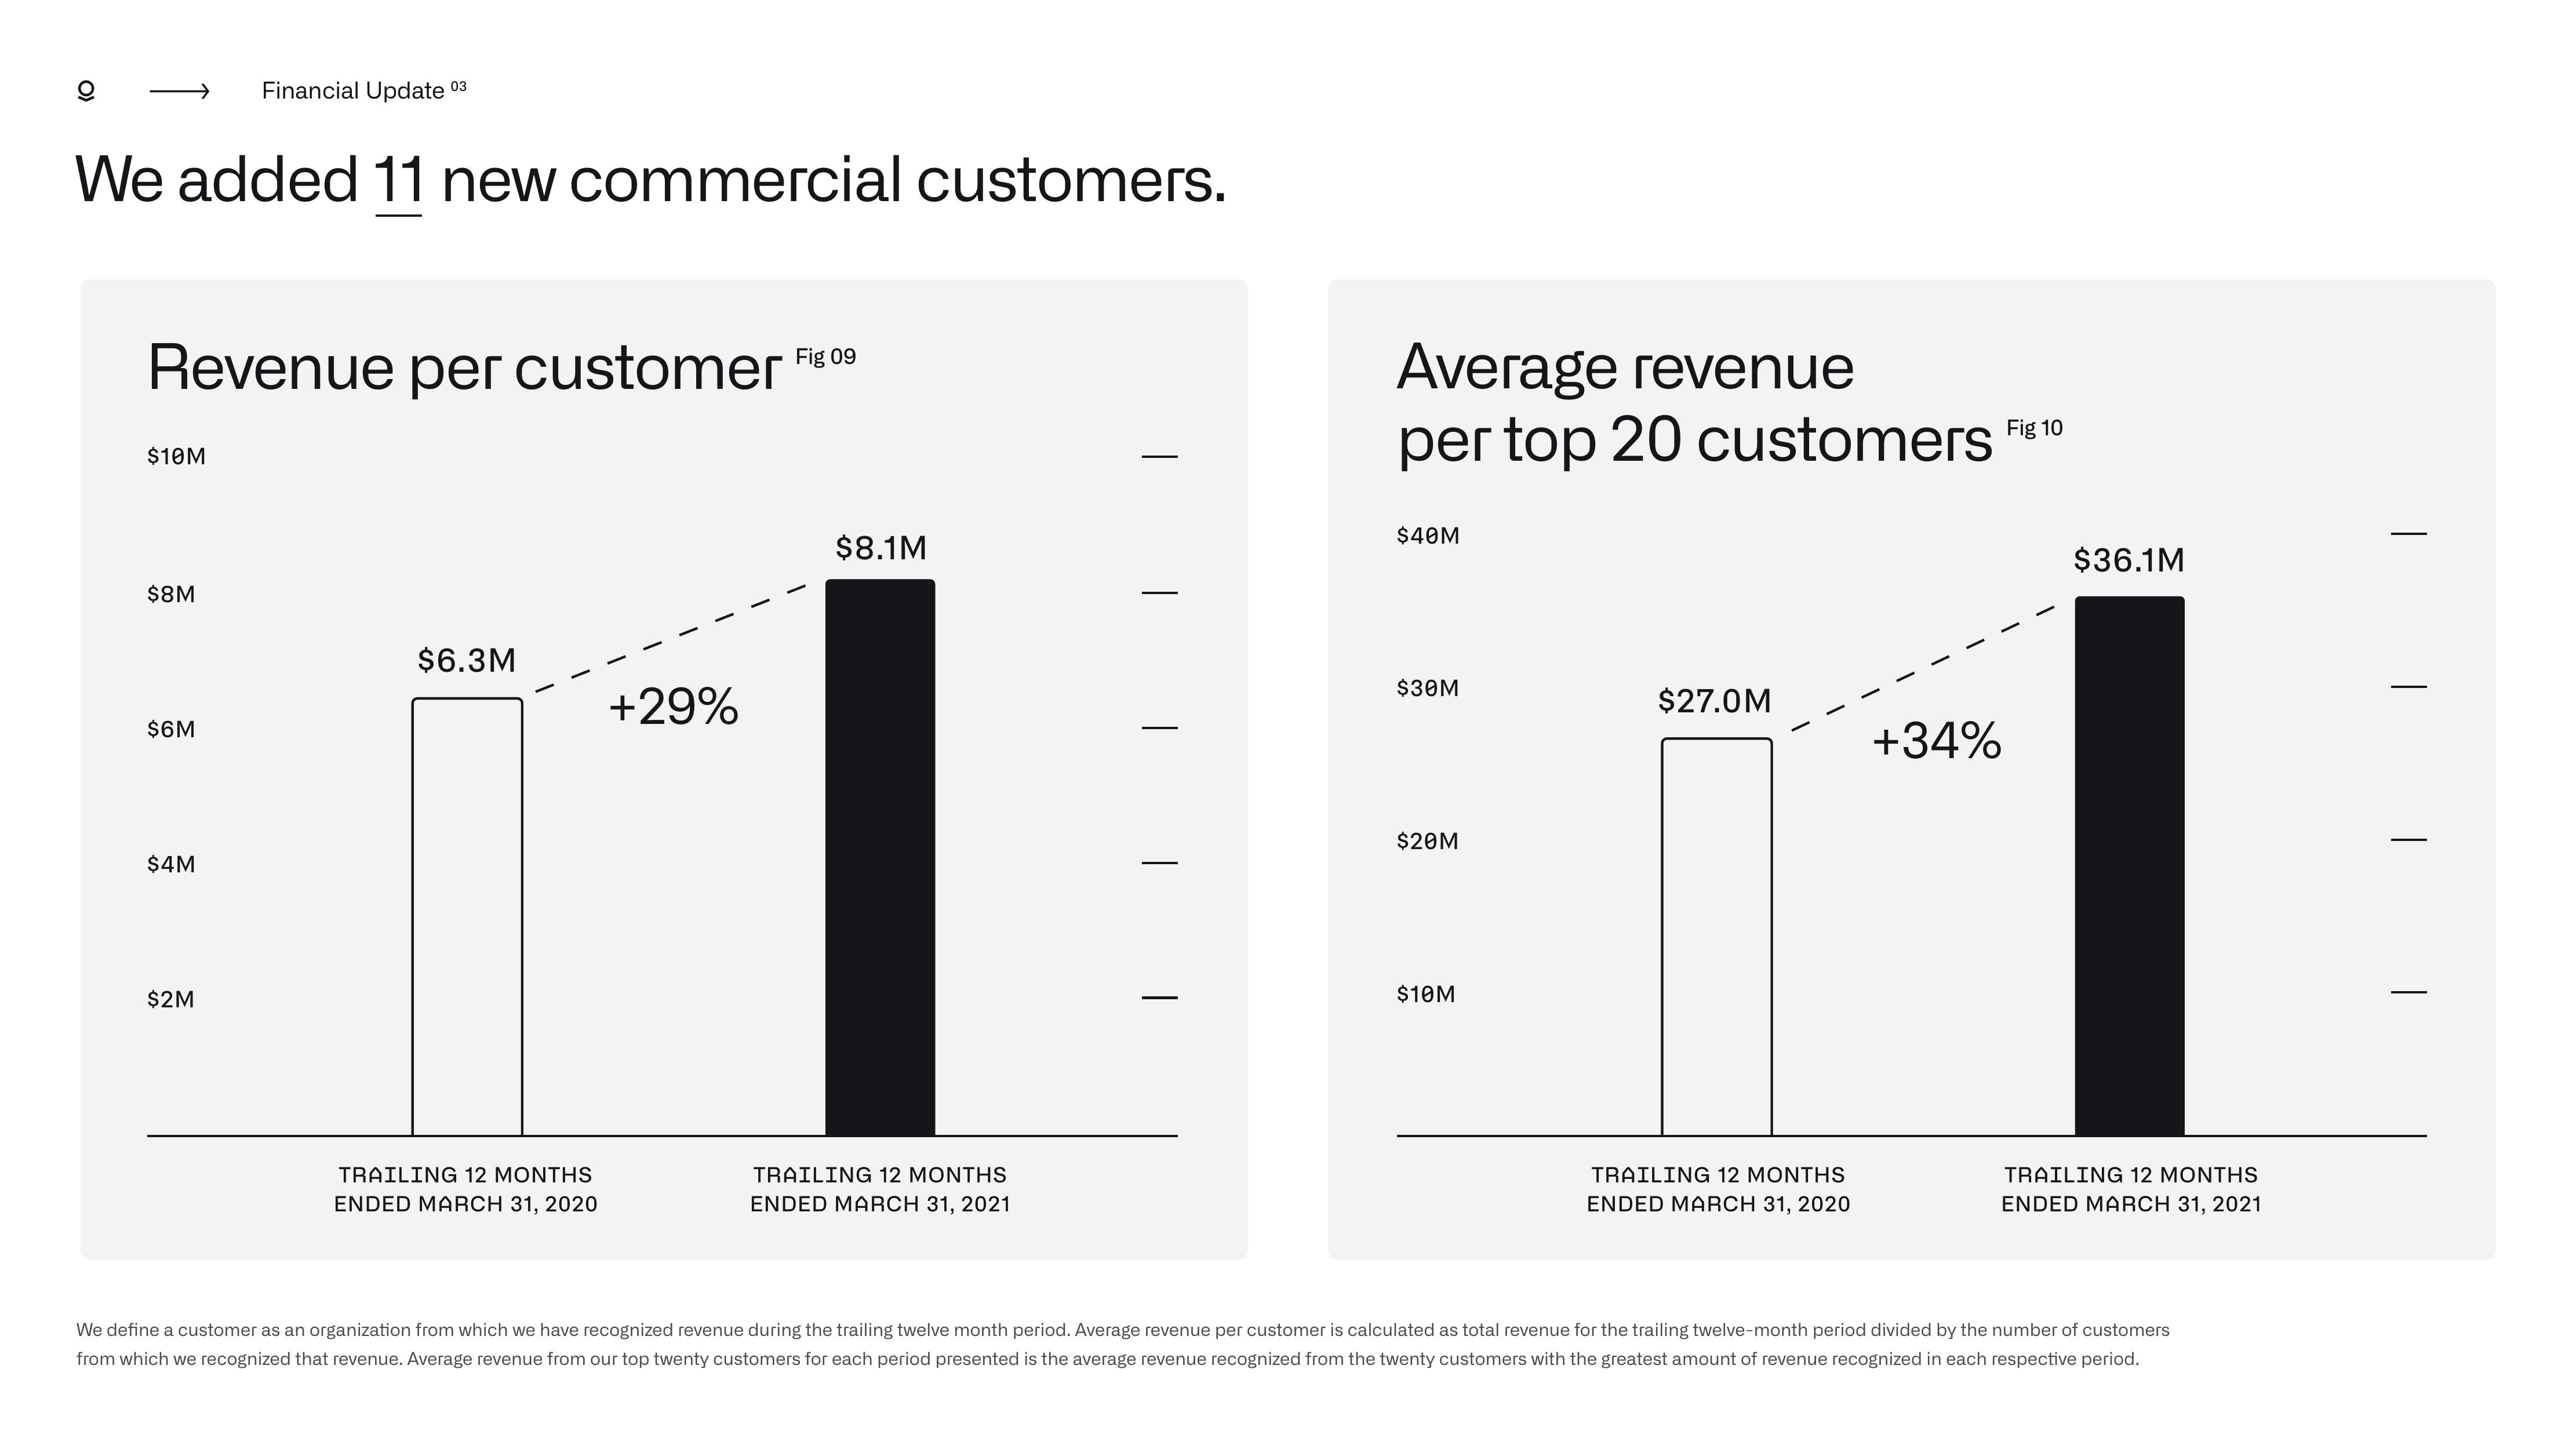
We added 11 new commercial customers.
Revenue per customer Fig 09
$10M
$8M
$6M
Financial Update 03
$4M
$2M
$6.3M
TRAILING 12 MONTHS
ENDED MARCH 31, 2020
+29%
$8.1M
TRAILING 12 MONTHS
ENDED MARCH 31, 2021
| |
Average revenue
per top 20 customers
$40M
$30M
$20M
$10M
$27.0M
TRAILING 12 MONTHS
ENDED MARCH 31, 2020
+34%
Fig 10
$36.1M
TRAILING 12 MONTHS
ENDED MARCH 31, 2021
We define a customer as an organization from which we have recognized revenue during the trailing twelve month period. Average revenue per customer is calculated as total revenue for the trailing twelve-month period divided by the number of customers
from which we recognized that revenue. Average revenue from our top twenty customers for each period presented is the average revenue recognized from the twenty customers with the greatest amount of revenue recognized in each respective period.
I
T
TView entire presentation