Blend Results Presentation Deck
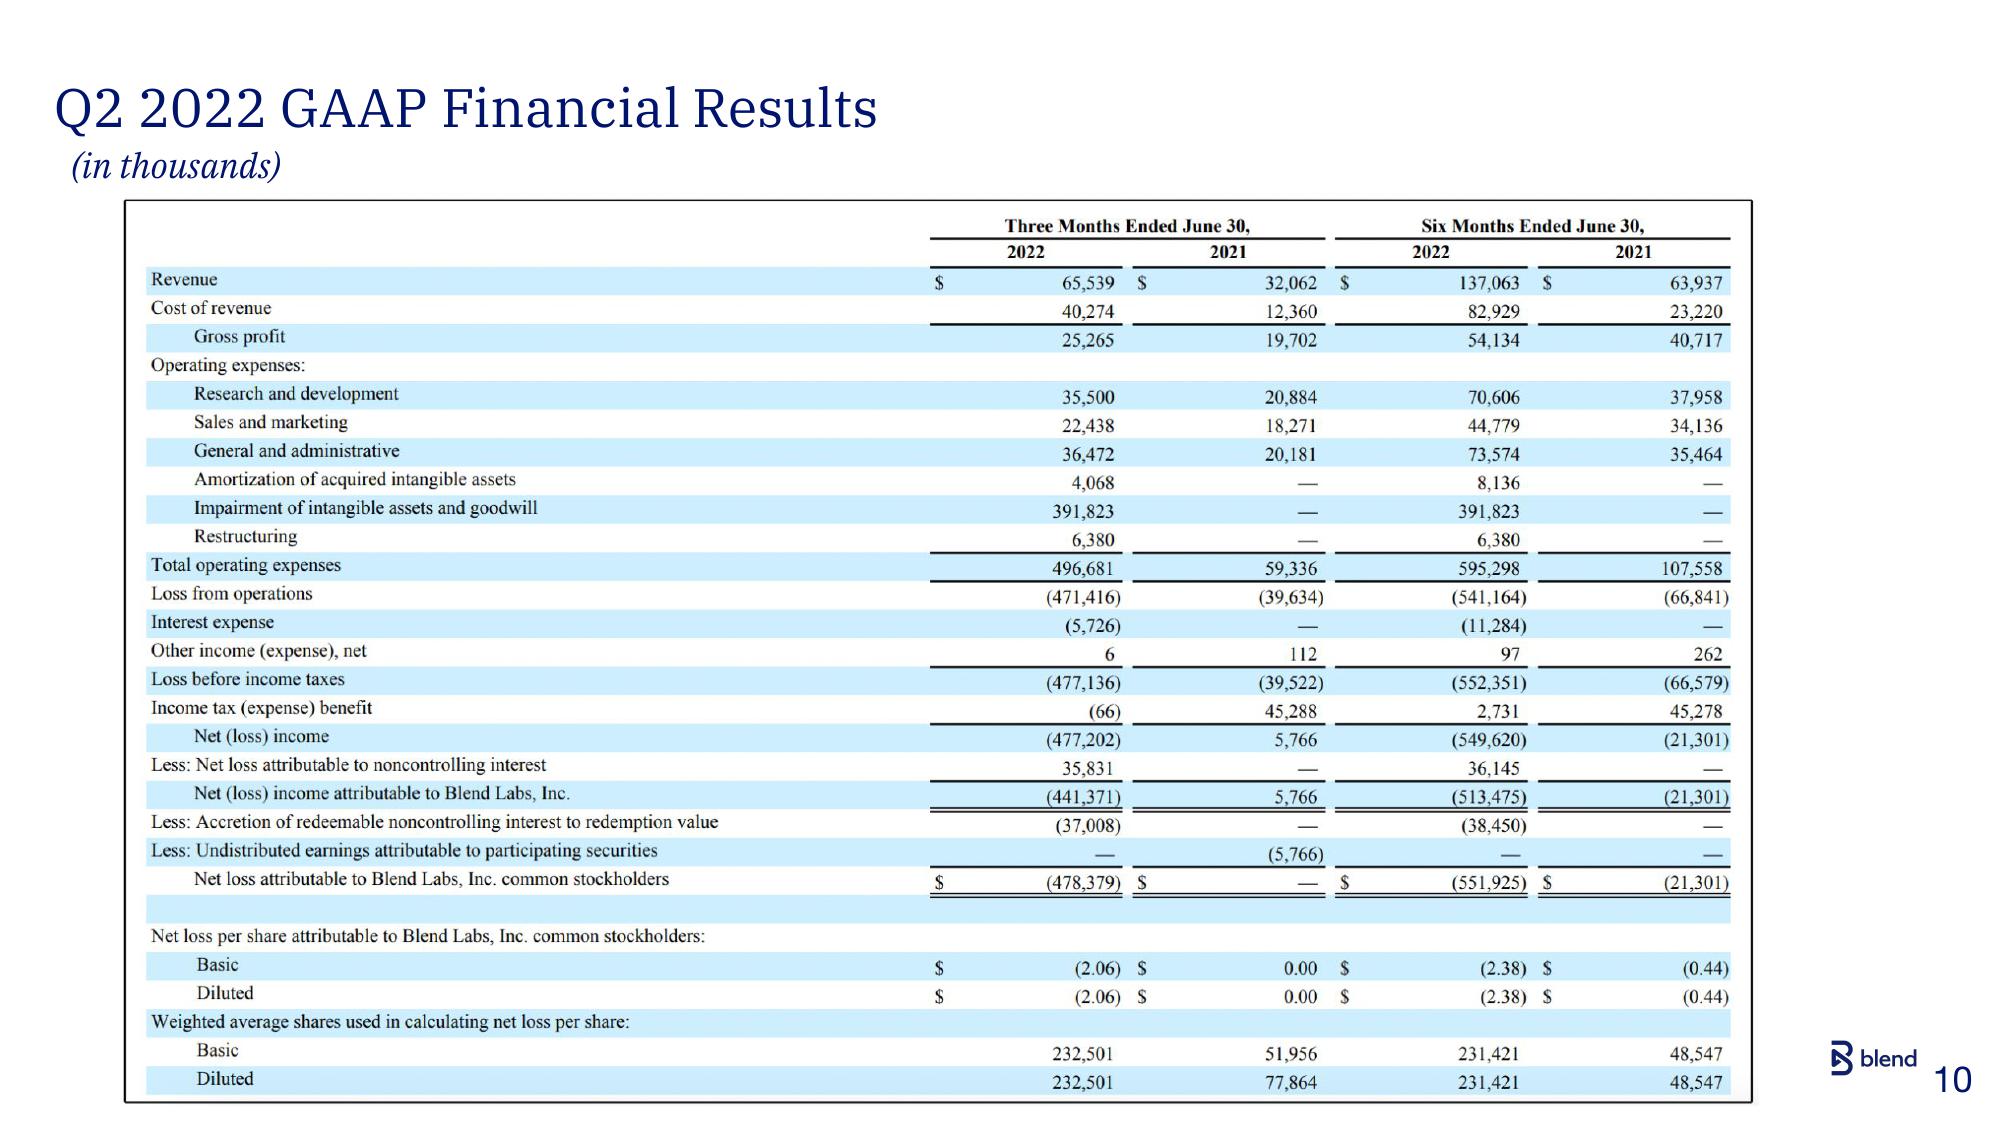
Q2 2022 GAAP Financial Results
(in thousands)
Revenue
Cost of revenue
Gross profit
Operating expenses:
Research and development
Sales and marketing
General and administrative
Amortization of acquired intangible assets
Impairment of intangible assets and goodwill
Restructuring
Total operating expenses
Loss from operations
Interest expense
Other income (expense), net
Loss before income taxes
Income tax (expense) benefit
Net (loss) income
Less: Net loss attributable to noncontrolling interest
Net (loss) income attributable to Blend Labs, Inc.
Less: Accretion of redeemable noncontrolling interest to redemption value
Less: Undistributed earnings attributable to participating securities
Net loss attributable to Blend Labs, Inc. common stockholders
Net loss per share attributable to Blend Labs, Inc. common stockholders:
Basic
Diluted
Weighted average shares used in calculating net loss per share:
Basic
Diluted
$
$
$
$
Three Months Ended June 30,
2022
2021
65,539 $
40,274
25,265
35,500
22,438
36,472
4,068
391,823
6,380
496,681
(471,416)
(5,726)
6
(477,136)
(66)
(477,202)
35,831
(441,371)
(37,008)
(478,379) S
(2.06) S
(2.06) S
232,501
232,501
32,062 $
12,360
19,702
20,884
18,271
20,181
59,336
(39,634)
112
(39,522)
45,288
5,766
5,766
(5,766)
$
0.00 $
0.00 S
51,956
77,864
Six Months Ended June 30,
2022
2021
137,063 $
82,929
54,134
70,606
44,779
73,574
8,136
391,823
6,380
595,298
(541,164)
(11,284)
97
(552,351)
2,731
(549,620)
36,145
(513,475)
(38,450)
(551,925) S
(2.38) S
(2.38) S
231,421
231,421
63,937
23,220
40,717
37,958
34,136
35,464
107,558
(66,841)
262
(66,579)
45,278
(21,301)
(21,301)
(21,301)
(0.44)
(0.44)
48,547
48,547
blend
10View entire presentation