Hydrafacial Investor Presentation Deck
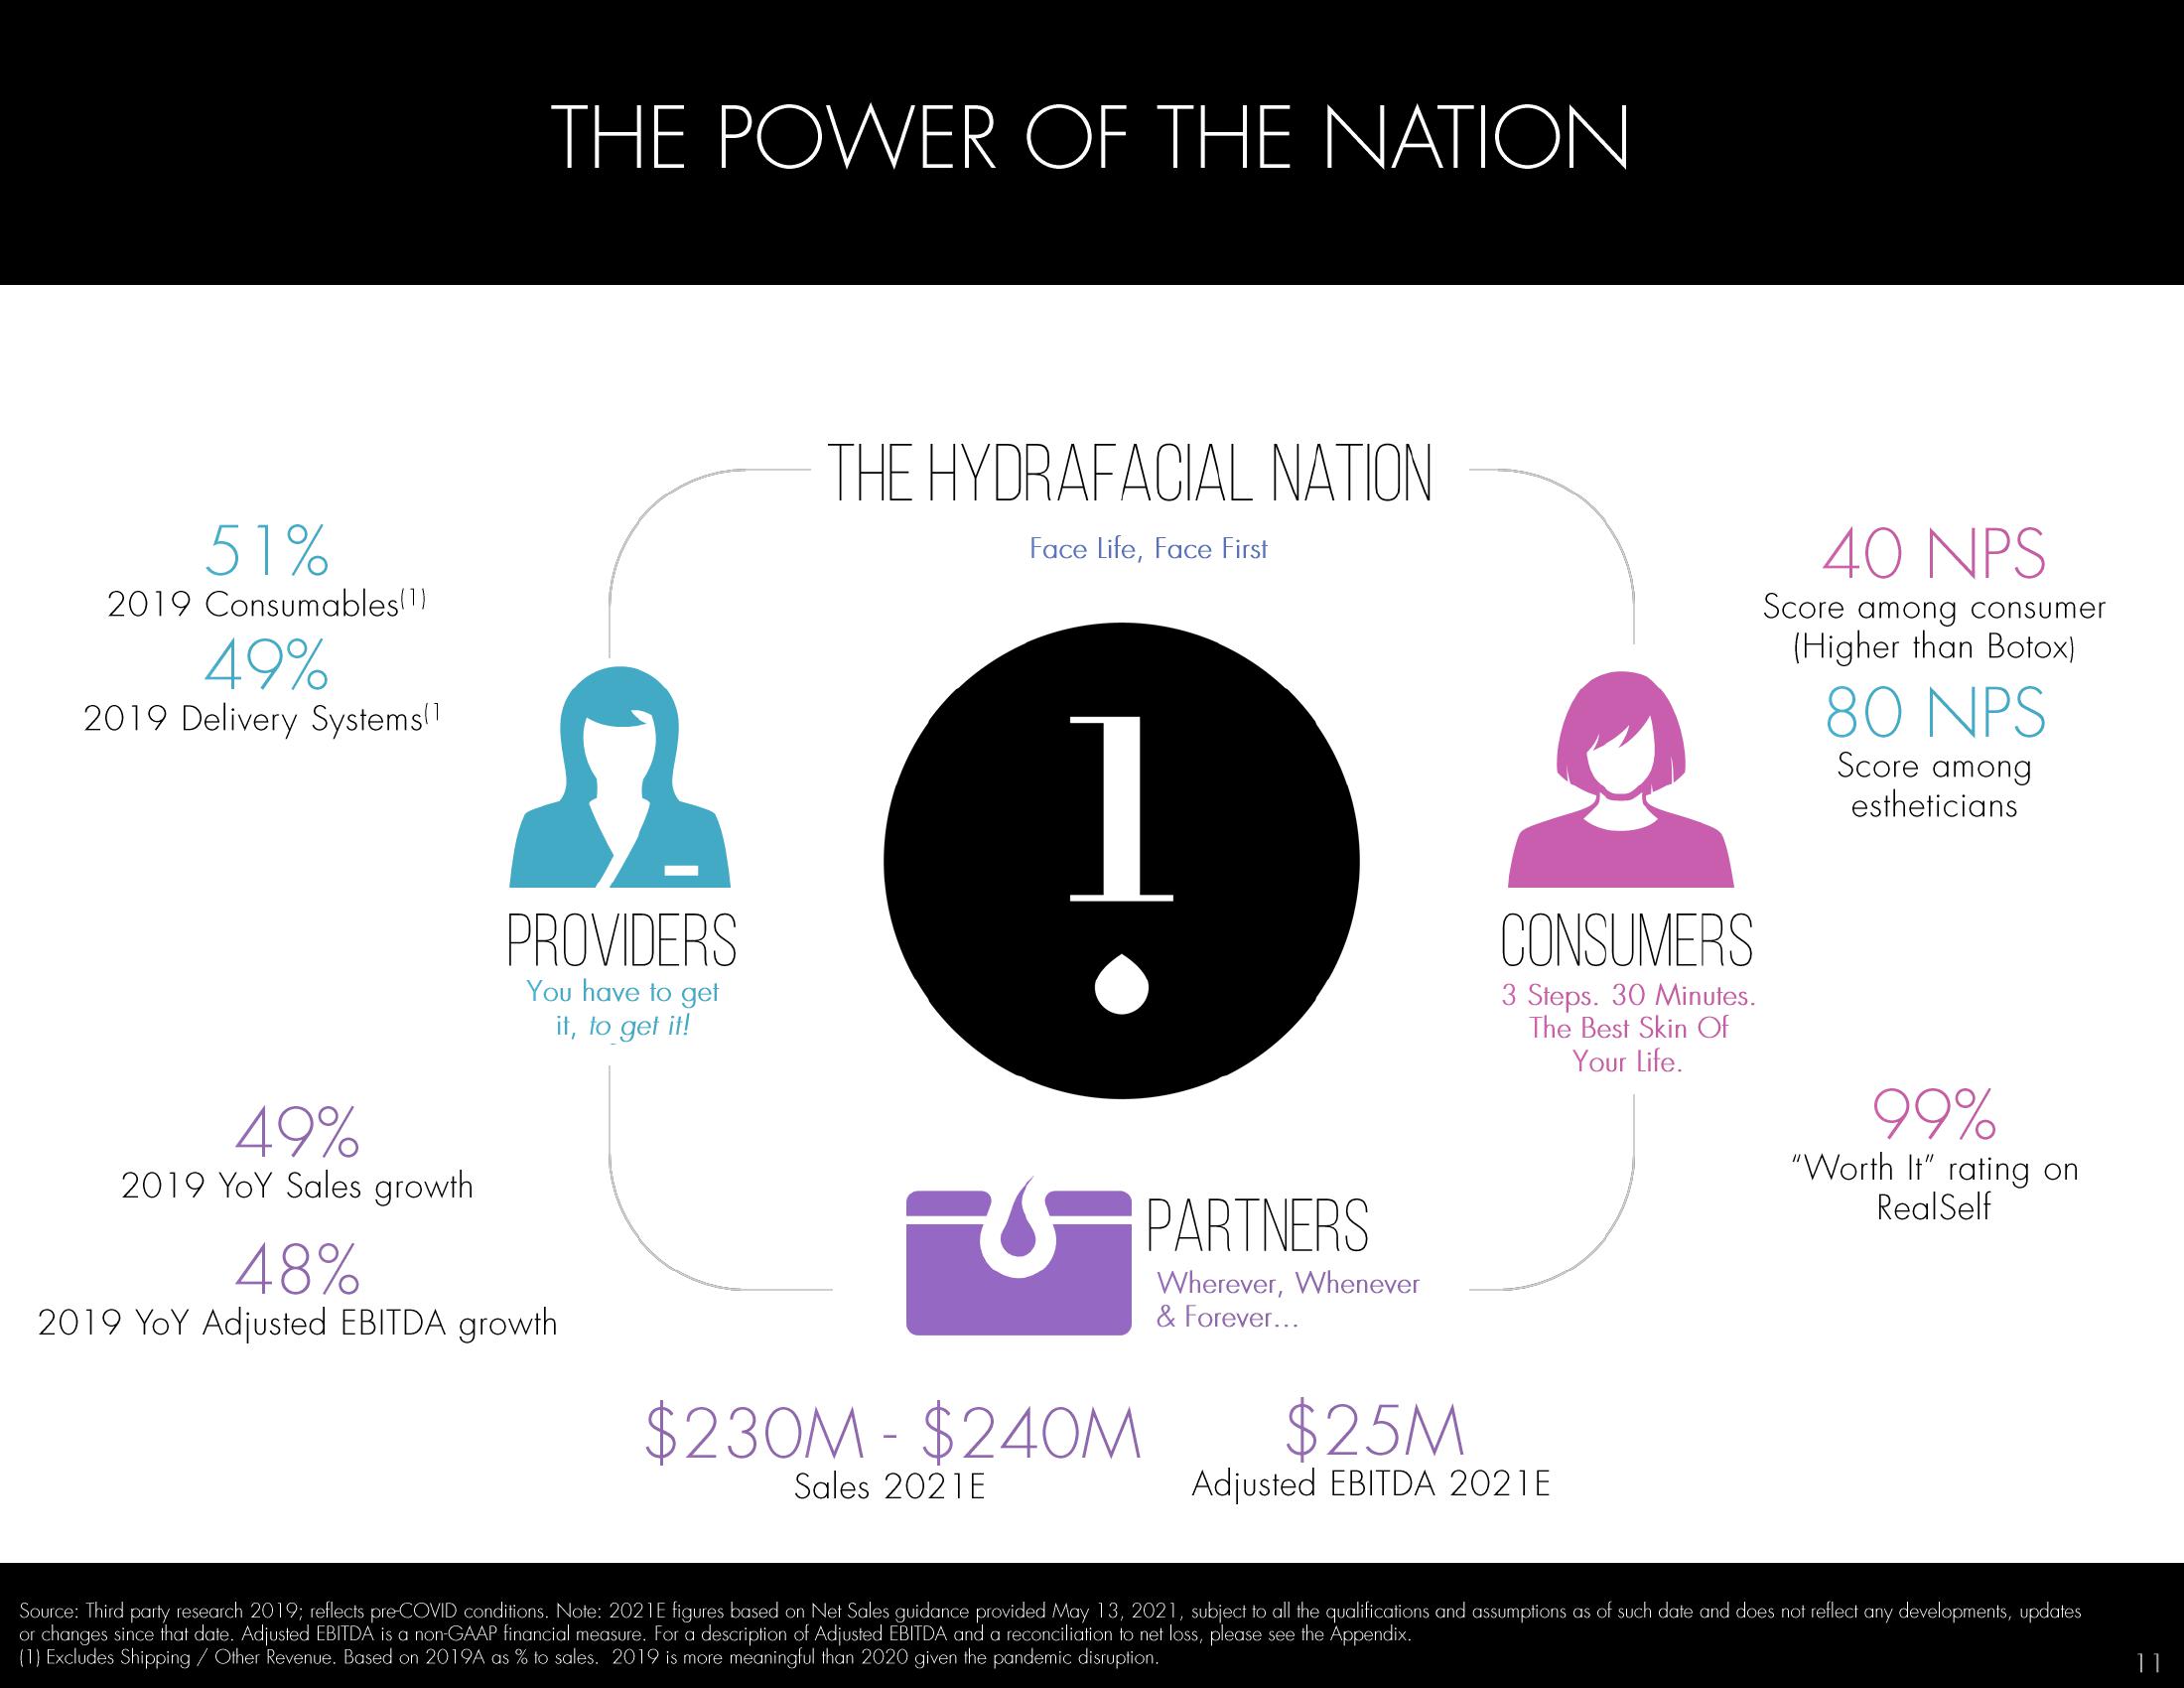
51%
2019 Consumables(1)
49%
2019 Delivery Systems
49%
2019 YOY Sales growth
THE POWER OF THE NATION
PROVIDERS
You have to get
it, to get it!
48%
2019 YOY Adjusted EBITDA growth
THE HYDRAFACIAL NATION
Face Life, Face First
F
$230M - $240M
Sales 2021E
PARTNERS
Wherever, Whenever
& Forever...
CONSUMERS
3 Steps. 30 Minutes.
The Best Skin Of
Your Life.
$25M
Adjusted EBITDA 2021E
40 NPS
Score among consumer
(Higher than Botox)
80 NPS
Score among
estheticians
99%
"Worth It" rating on
RealSelf
Source: Third party research 2019; reflects pre-COVID conditions. Note: 2021E figures based on Net Sales guidance provided May 13, 2021, subject to all the qualifications and assumptions as of such date and does not reflect any developments, updates
or changes since that date. Adjusted EBITDA is a non-GAAP financial measure. For a description of Adjusted EBITDA and a reconciliation to net loss, please see the Appendix.
(1) Excludes Shipping / Other Revenue. Based on 2019A as % to sales. 2019 is more meaningful than 2020 given the pandemic disruption.
11View entire presentation