Despegar Results Presentation Deck
1 G&A + T&PD ($M)
42.3
18.7
23.6
2. Operating Expenses remain stable QoQ
4019
38.2
19.5
18.7
4Q21
44.3
20.7
23.5
1Q22
48.4
21.4
27.0
2Q22
G&A T&PD
47.7
22.8
24.9
3Q22
51.1
25.0
26.1
4Q22
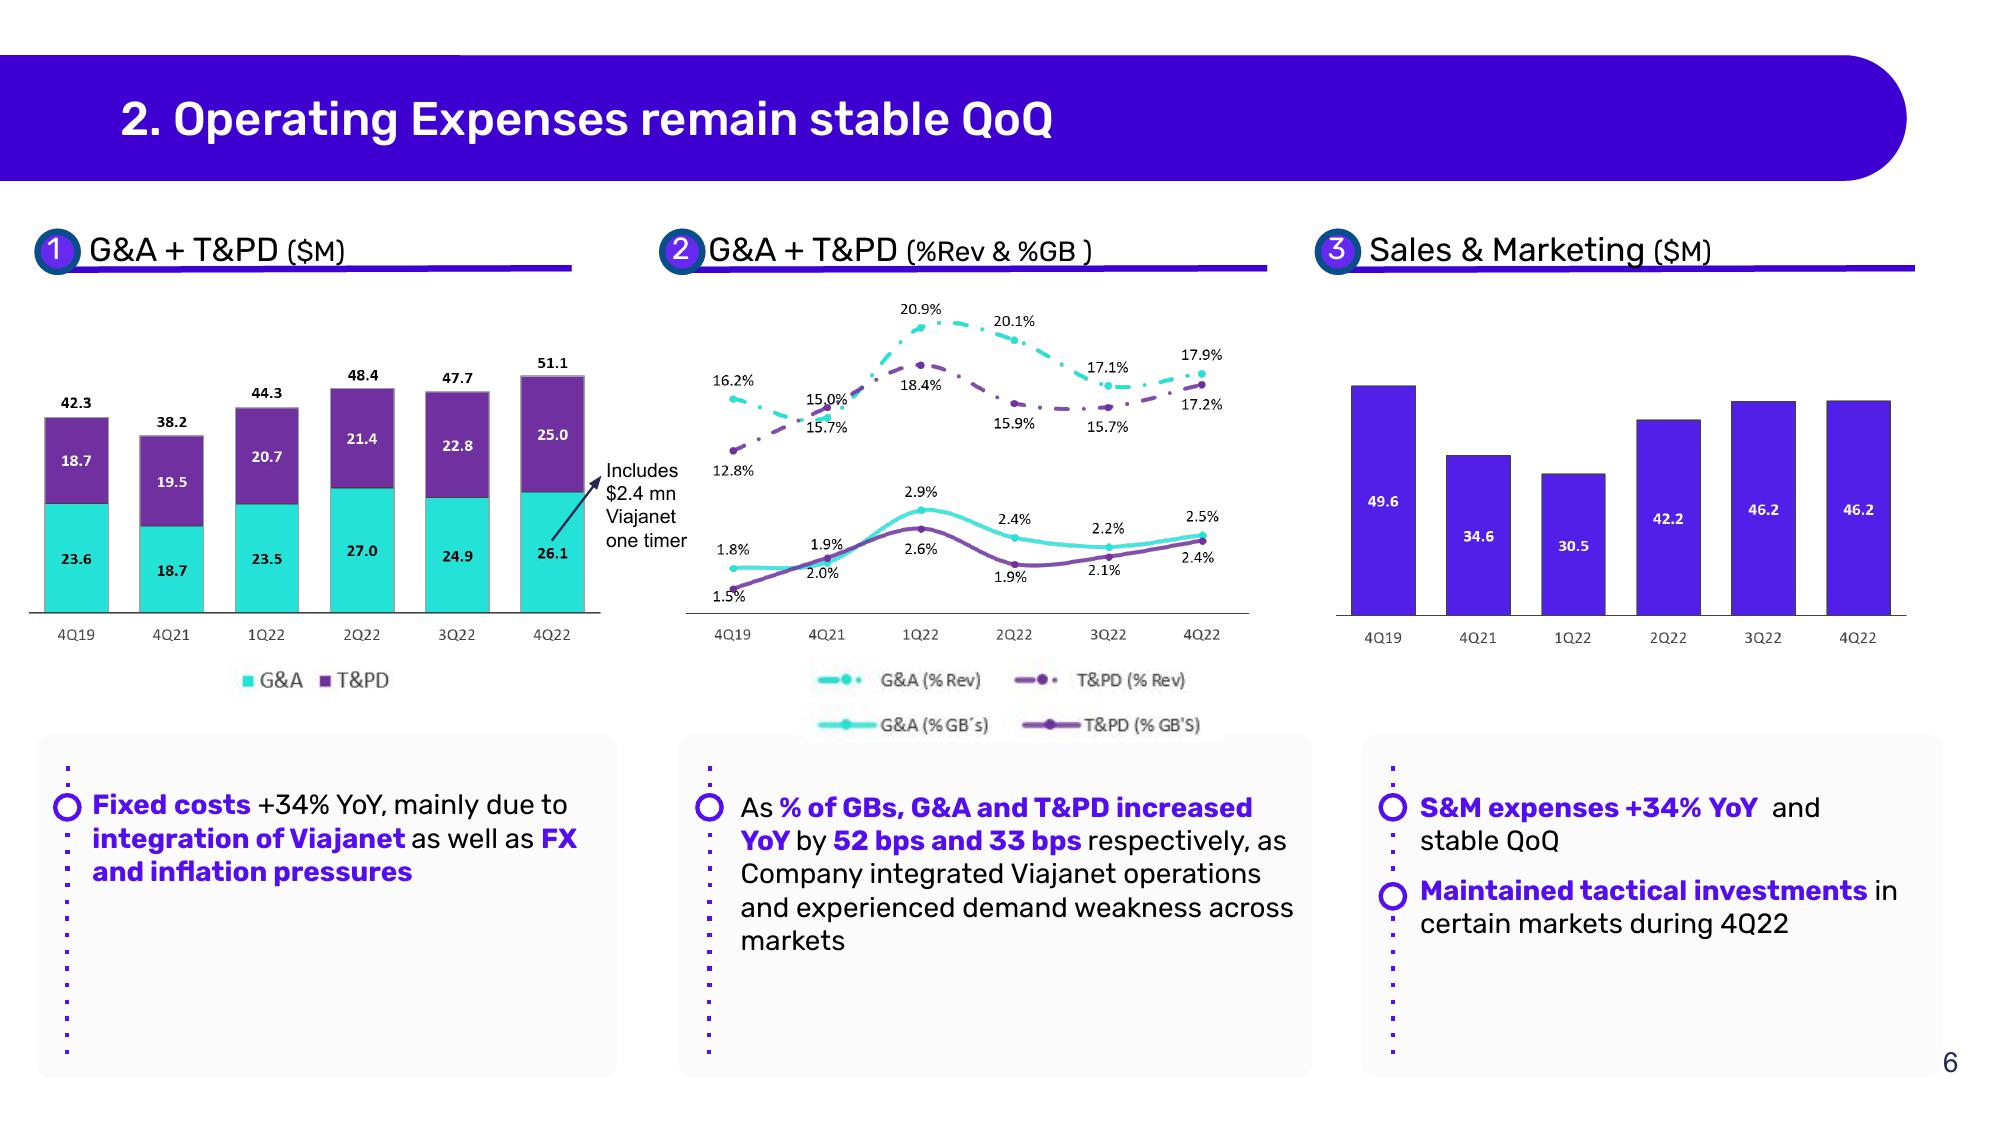
Fixed costs +34% YoY, mainly due to
integration of Viajanet as well as FX
and inflation pressures
2 G&A + T&PD (%Rev & %GB )
16.2%
Includes 12.8%
$2.4 mn
Viajanet
one timer
1.8%
1.5%
4Q19
15,0%
15.7%
1.9%
2.0%
4Q21
20.9%
18.4%
2.9%
2.6%
1022
<- G&A (% Rev)
G&A (% GB's)
20.1%
15.9%
2.4%
1.9%
2Q22
17.1%
15.7%
2.2%
2.1%
3Q22
17.9%
17.2%
2.5%
2.4%
4022
T&PD (% Rev)
T&PD (% GB'S)
As % of GBs, G&A and T&PD increased
YOY by 52 bps and 33 bps respectively, as
Company integrated Viajanet operations
and experienced demand weakness across
markets
3 Sales & Marketing ($M)
49.6
4Q19
34.6
4Q21
30.5
1Q22
42.2
2Q22
46.2
3Q22
S&M expenses +34% YoY and
stable QoQ
46.2
4Q22
Maintained tactical investments in
certain markets during 4022
6View entire presentation