Palantir Results Presentation Deck slide image

Palantir Results Presentation Deck

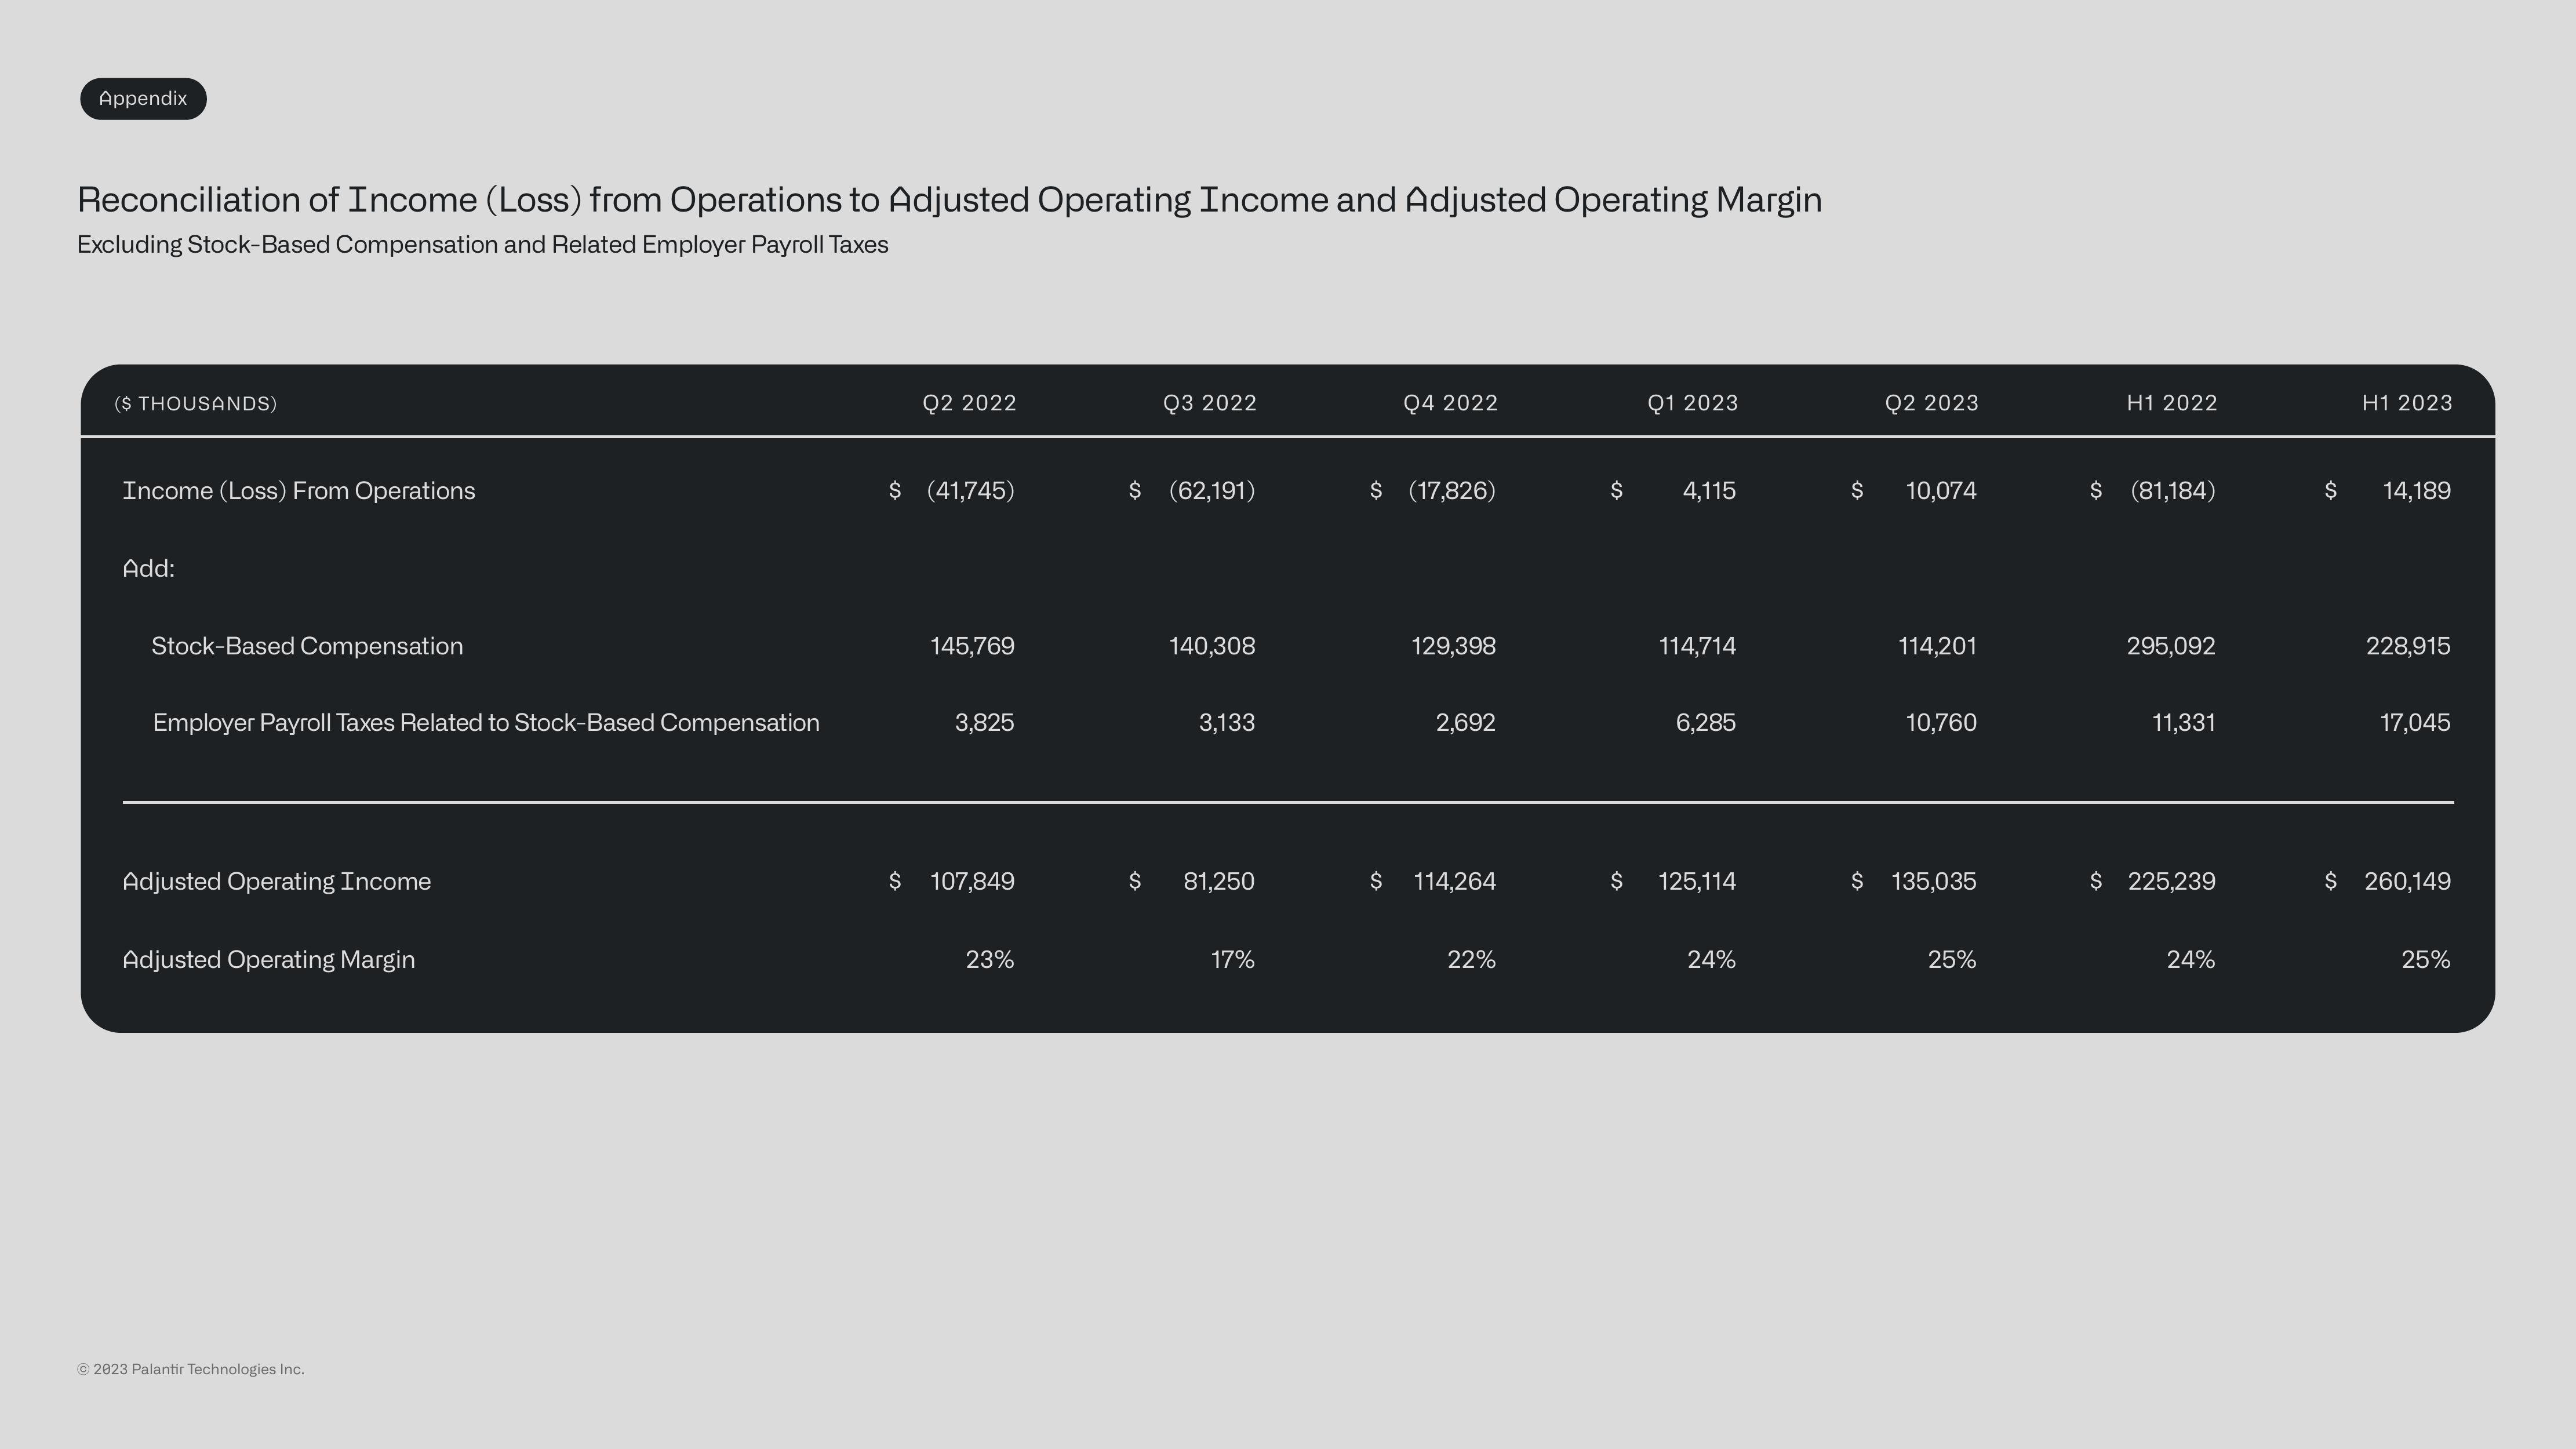
Appendix Reconciliation of Income (Loss) from Operations to Adjusted Operating Income and Adjusted Operating Margin Excluding Stock-Based Compensation and Related Employer Payroll Taxes ($ THOUSANDS) Income (Loss) From Operations Add: Stock-Based Compensation Employer Payroll Taxes Related to Stock-Based Compensation Adjusted Operating Income Adjusted Operating Margin Ⓒ2023 Palantir Technologies Inc. Q2 2022 $ (41,745) 145,769 3,825 $ 107,849 23% Q3 2022 $ (62,191) 140,308 3,133 $ 81,250 17% Q4 2022 $ (17,826) 129,398 2,692 $ 114,264 22% Q1 2023 $ 4,115 114,714 6,285 $ 125,114 24% $ Q2 2023 10,074 114,201 10,760 $ 135,035 25% H1 2022 $ (81,184) 295,092 11,331 $ 225,239 24% $ H1 2023 14,189 228,915 17,045 $ 260,149 25%
View entire presentation