OpenText Investor Presentation Deck
Strong Cash Flow and Balance Sheet
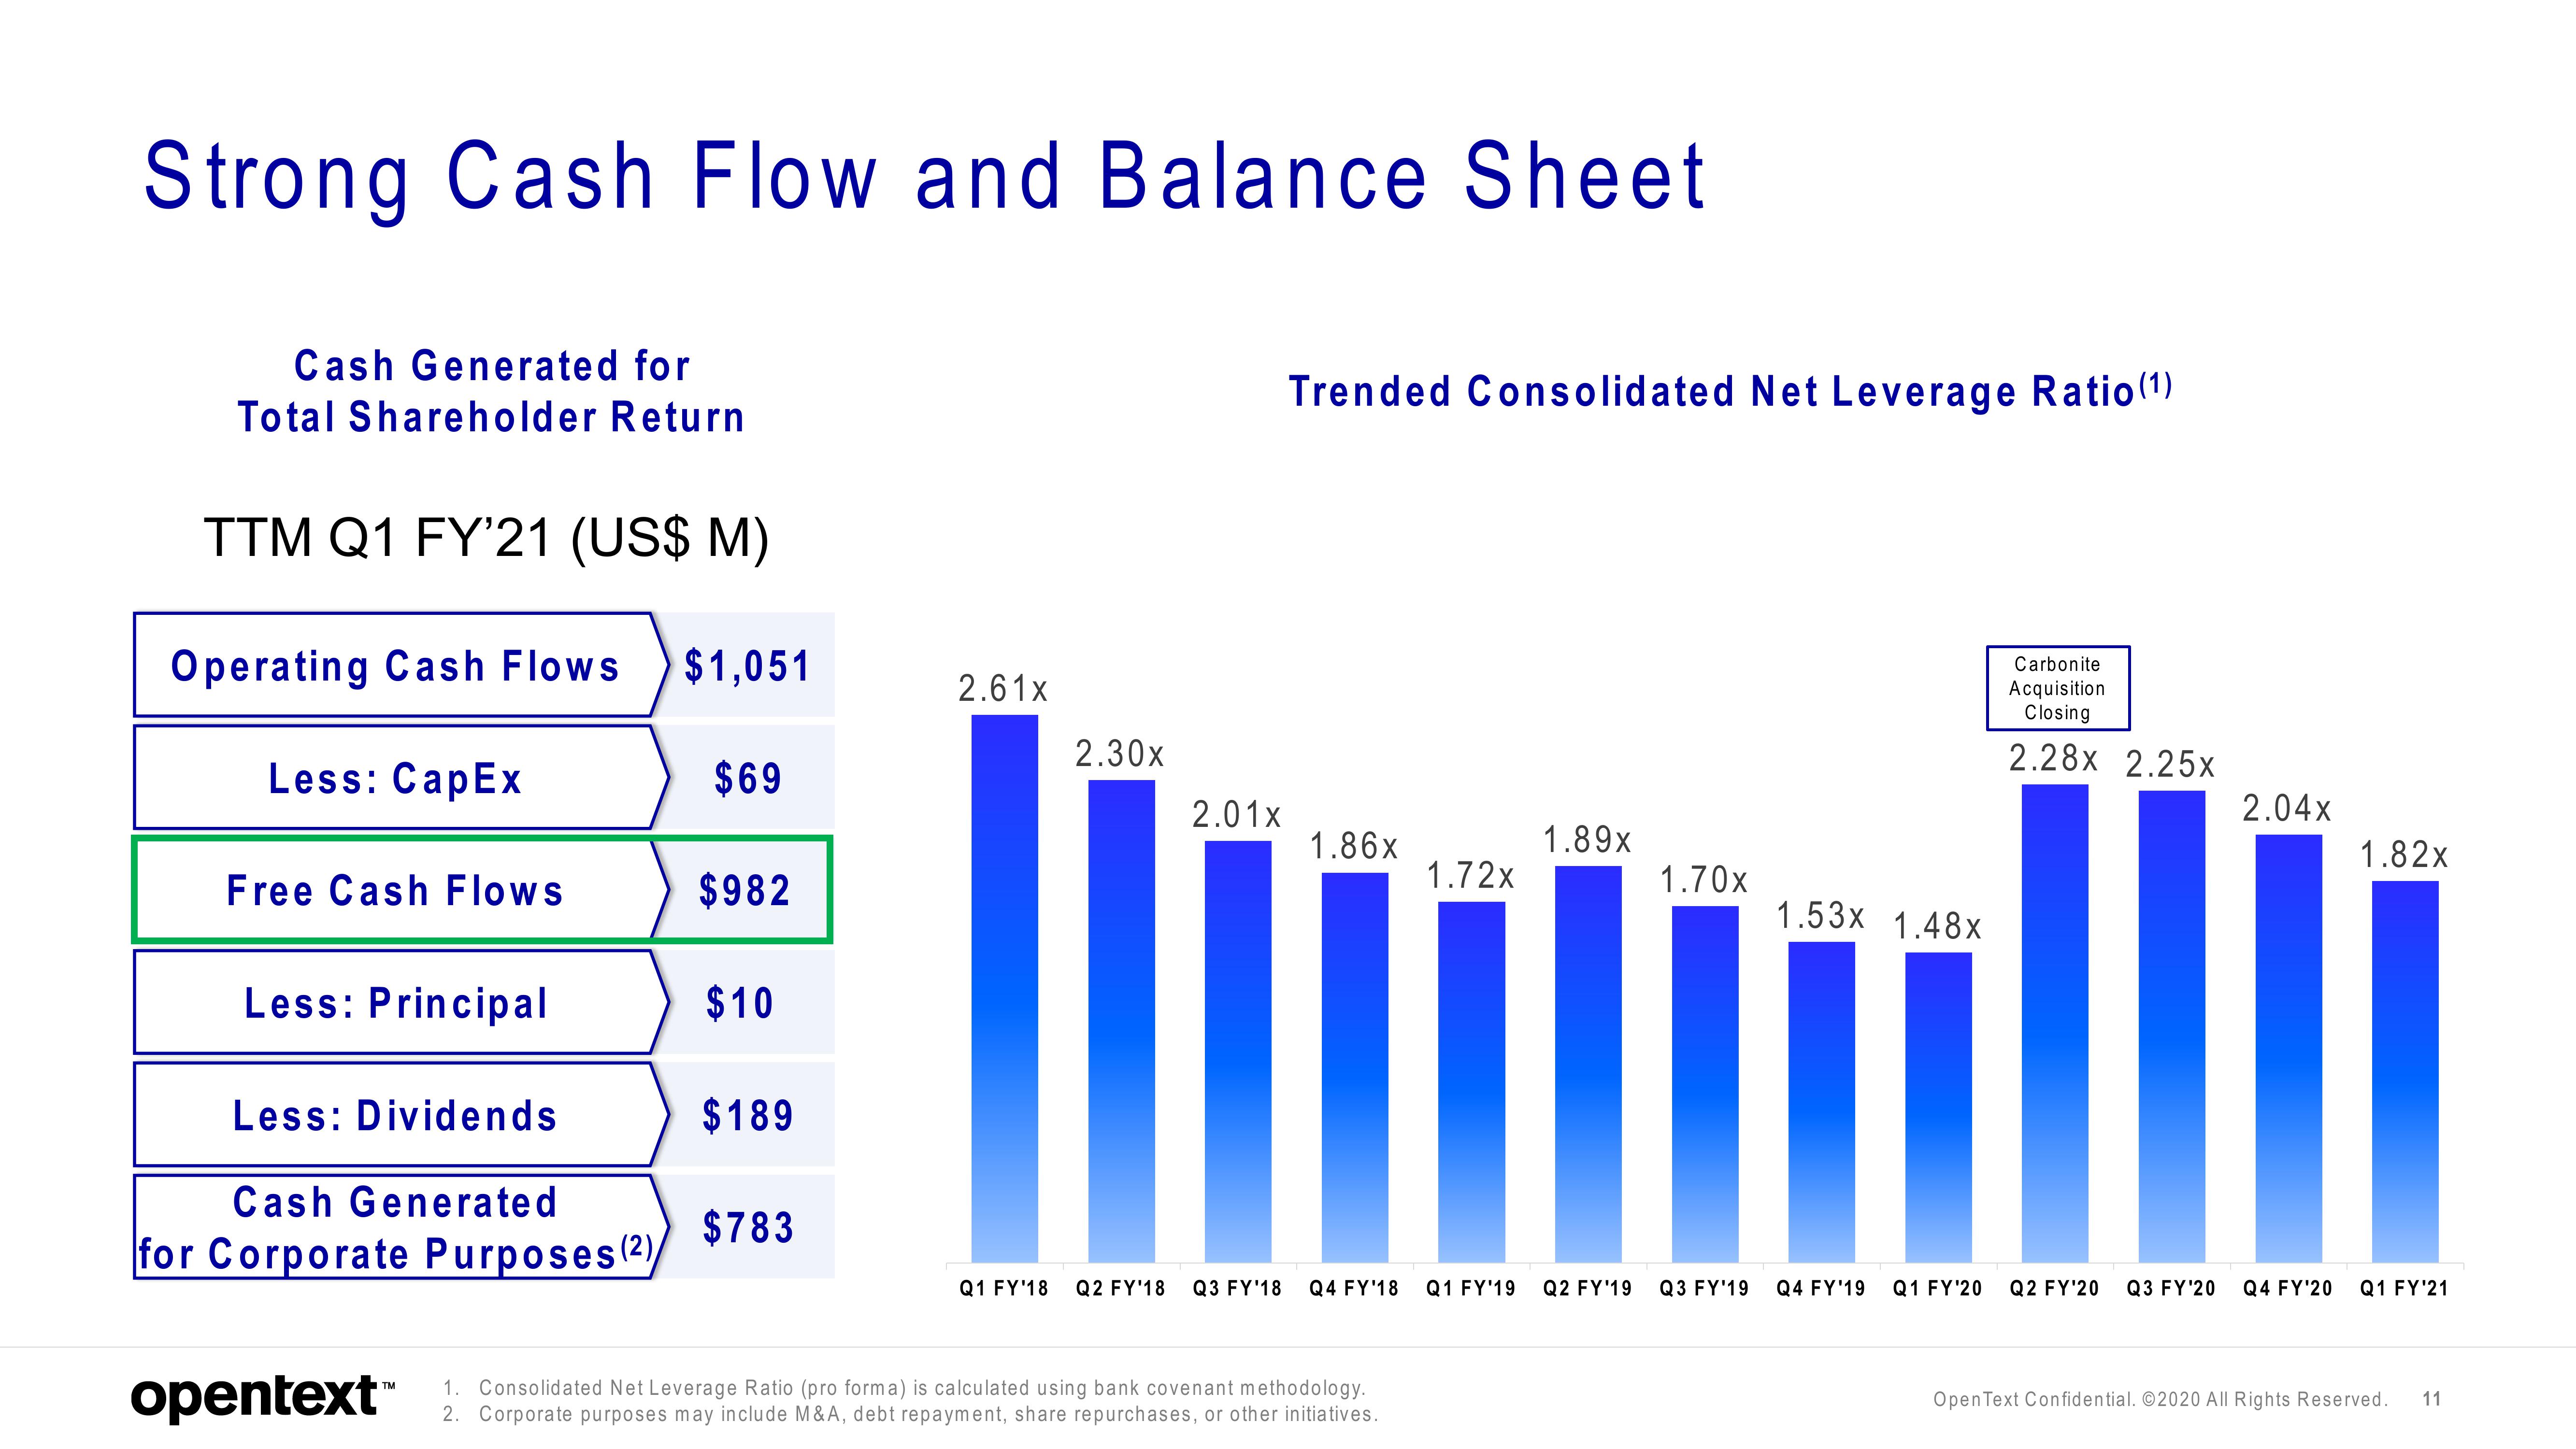
Cash Generated for
Total Shareholder Return
TTM Q1 FY'21 (US$ M)
Operating Cash Flows $1,051
Less: CapEx
Free Cash Flows
Less: Principal
Less: Dividends
Cash Generated
for Corporate Purposes (2)
opentext™
$69
$982
$10
$189
$783
2.61X
2.30x
2.01x
Trended Consolidated Net Leverage Ratio (¹)
1.86x
Q1 FY'18 Q2 FY'18 Q3 FY'18 Q4 FY'18
1. Consolidated Net Leverage Ratio (pro forma) is calculated using bank covenant methodology.
2. Corporate purposes may include M&A, debt repayment, share repurchases, or other initiatives.
1.72x
1.89x
1.70x
Q1 FY'19 Q2 FY'19 Q3 FY'19
1.53x 1.48x
Q4 FY¹19
Q1 FY'20
Carbonite
Acquisition
Closing
2.28x 2.25x
Q2 FY'20
Q3 FY'20
2.04x
1.82x
Q4 FY'20 Q1 FY'21
Open Text Confidential. ©2020 All Rights Reserved.
11View entire presentation