Pershing Square Activist Presentation Deck
Best-in-Class Unit Economics
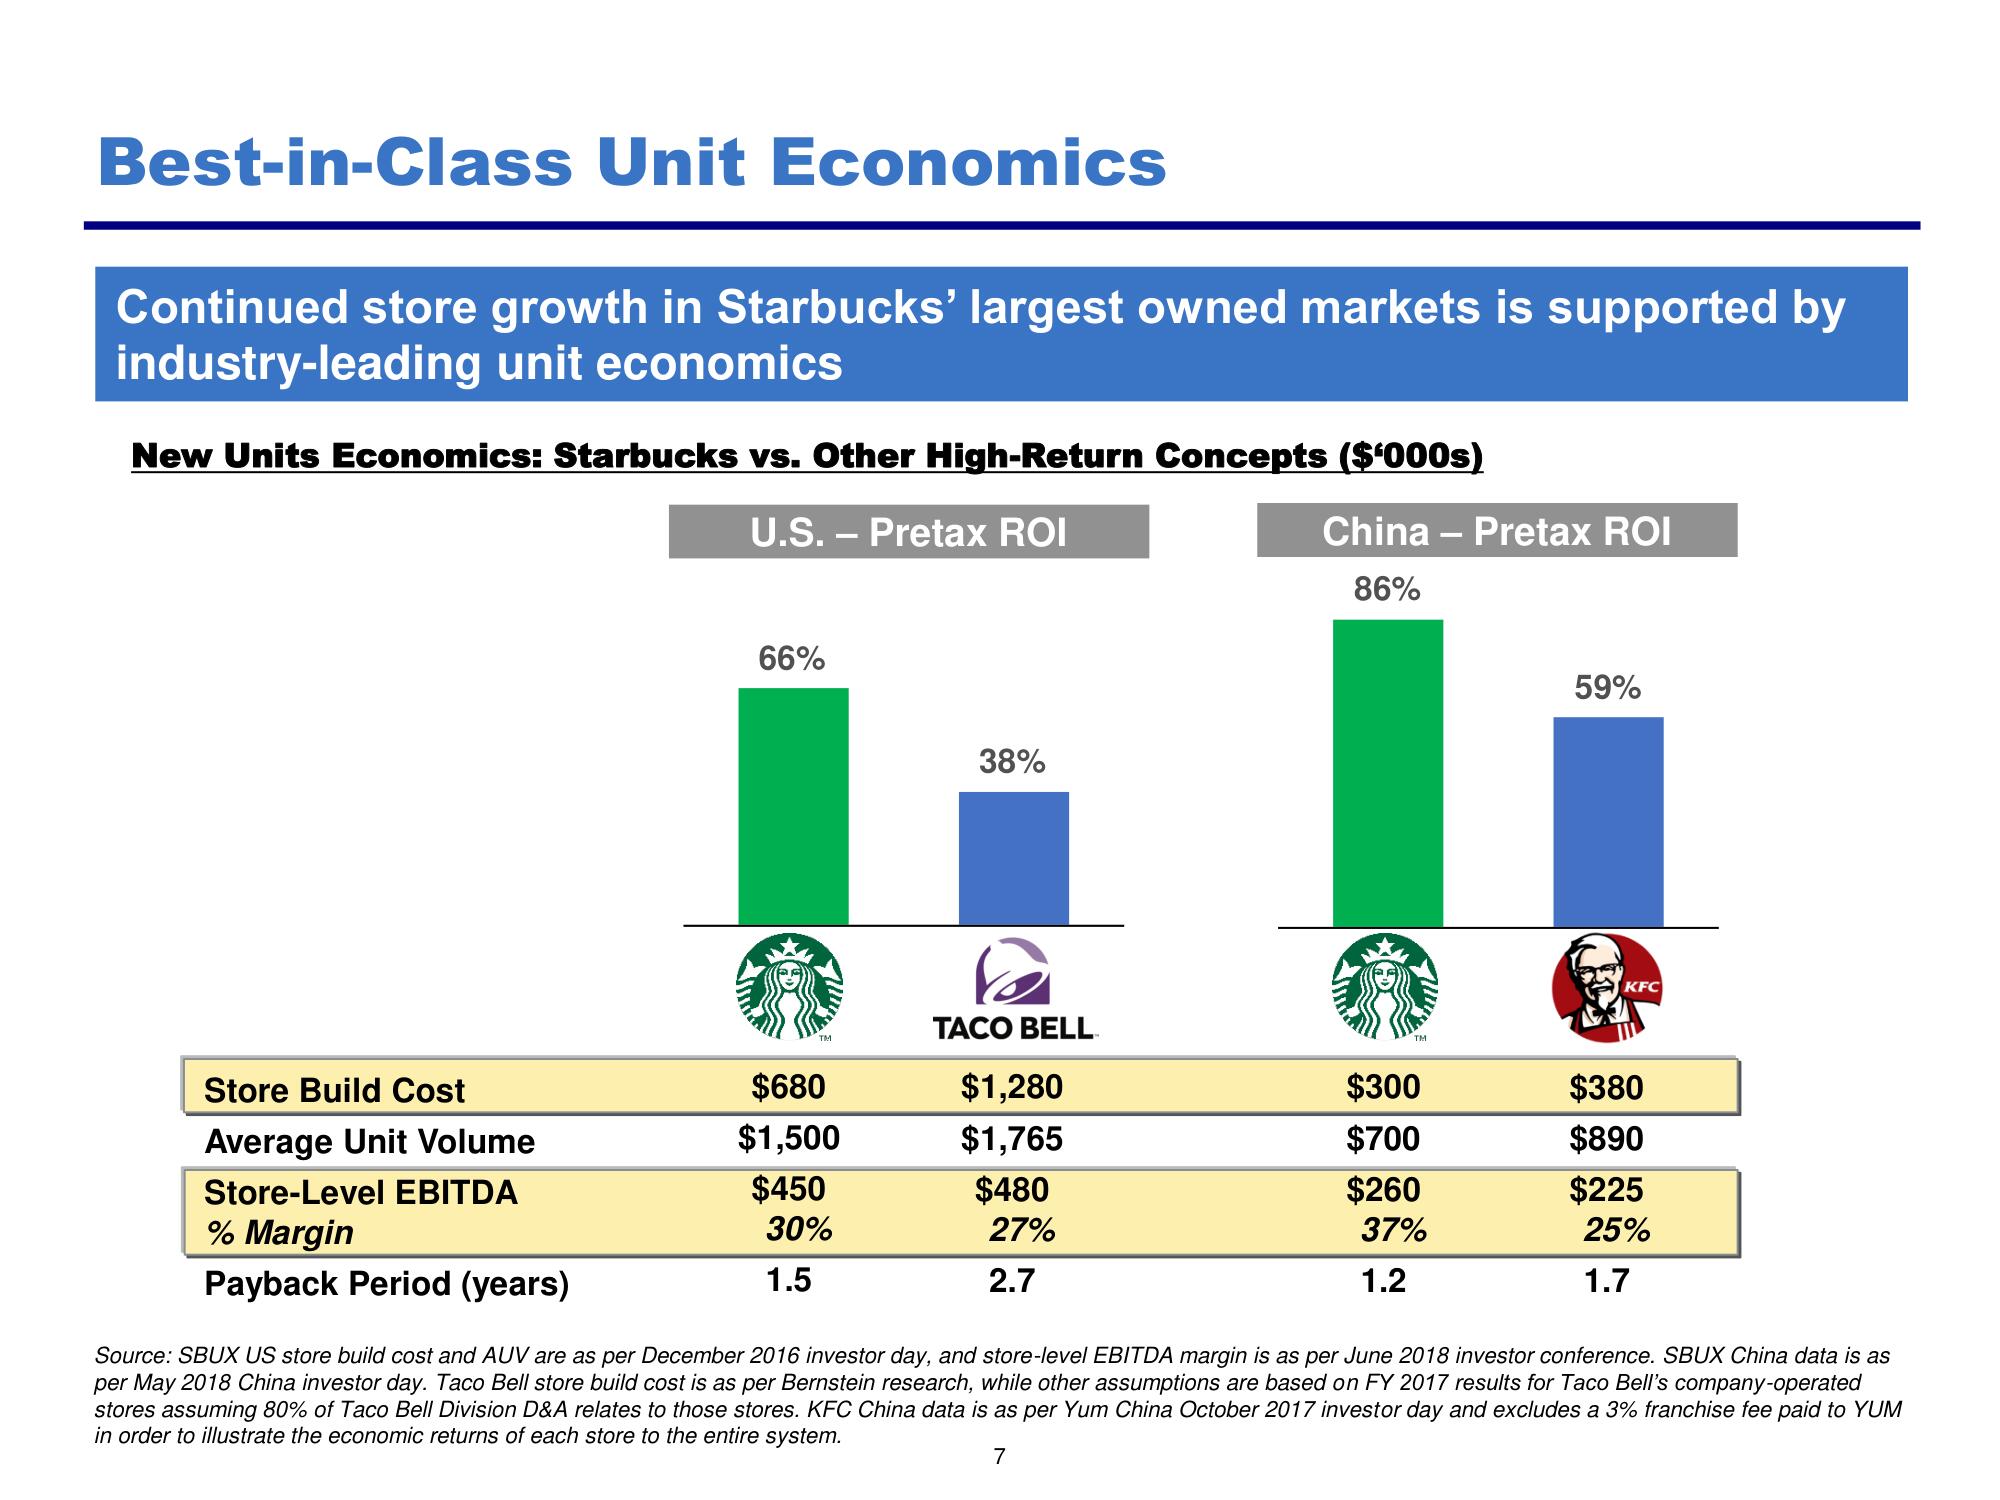
Continued store growth in Starbucks' largest owned markets is supported by
industry-leading unit economics
New Units Economics: Starbucks vs. Other High-Return Concepts ($¹000s)
U.S. - Pretax ROI
Store Build Cost
Average Unit Volume
Store-Level EBITDA
% Margin
Payback Period (years)
66%
TM
$680
$1,500
$450
30%
1.5
38%
TACO BELL
$1,280
$1,765
$480
27%
2.7
China - Pretax ROI
86%
TM
$300
$700
$260
37%
1.2
59%
KFC
$380
$890
$225
25%
1.7
Source: SBUX US store build cost and AUV are as per December 2016 investor day, and store-level EBITDA margin is as per June 2018 investor conference. SBUX China data is as
per May 2018 China investor day. Taco Bell store build cost is as per Bernstein research, while other assumptions are based on FY 2017 results for Taco Bell's company-operated
stores assuming 80% of Taco Bell Division D&A relates to those stores. KFC China data is as per Yum China October 2017 investor day and excludes a 3% franchise fee paid to YUM
in order to illustrate the economic returns of each store to the entire system.
7View entire presentation