Kore Results Presentation Deck slide image

Kore Results Presentation Deck

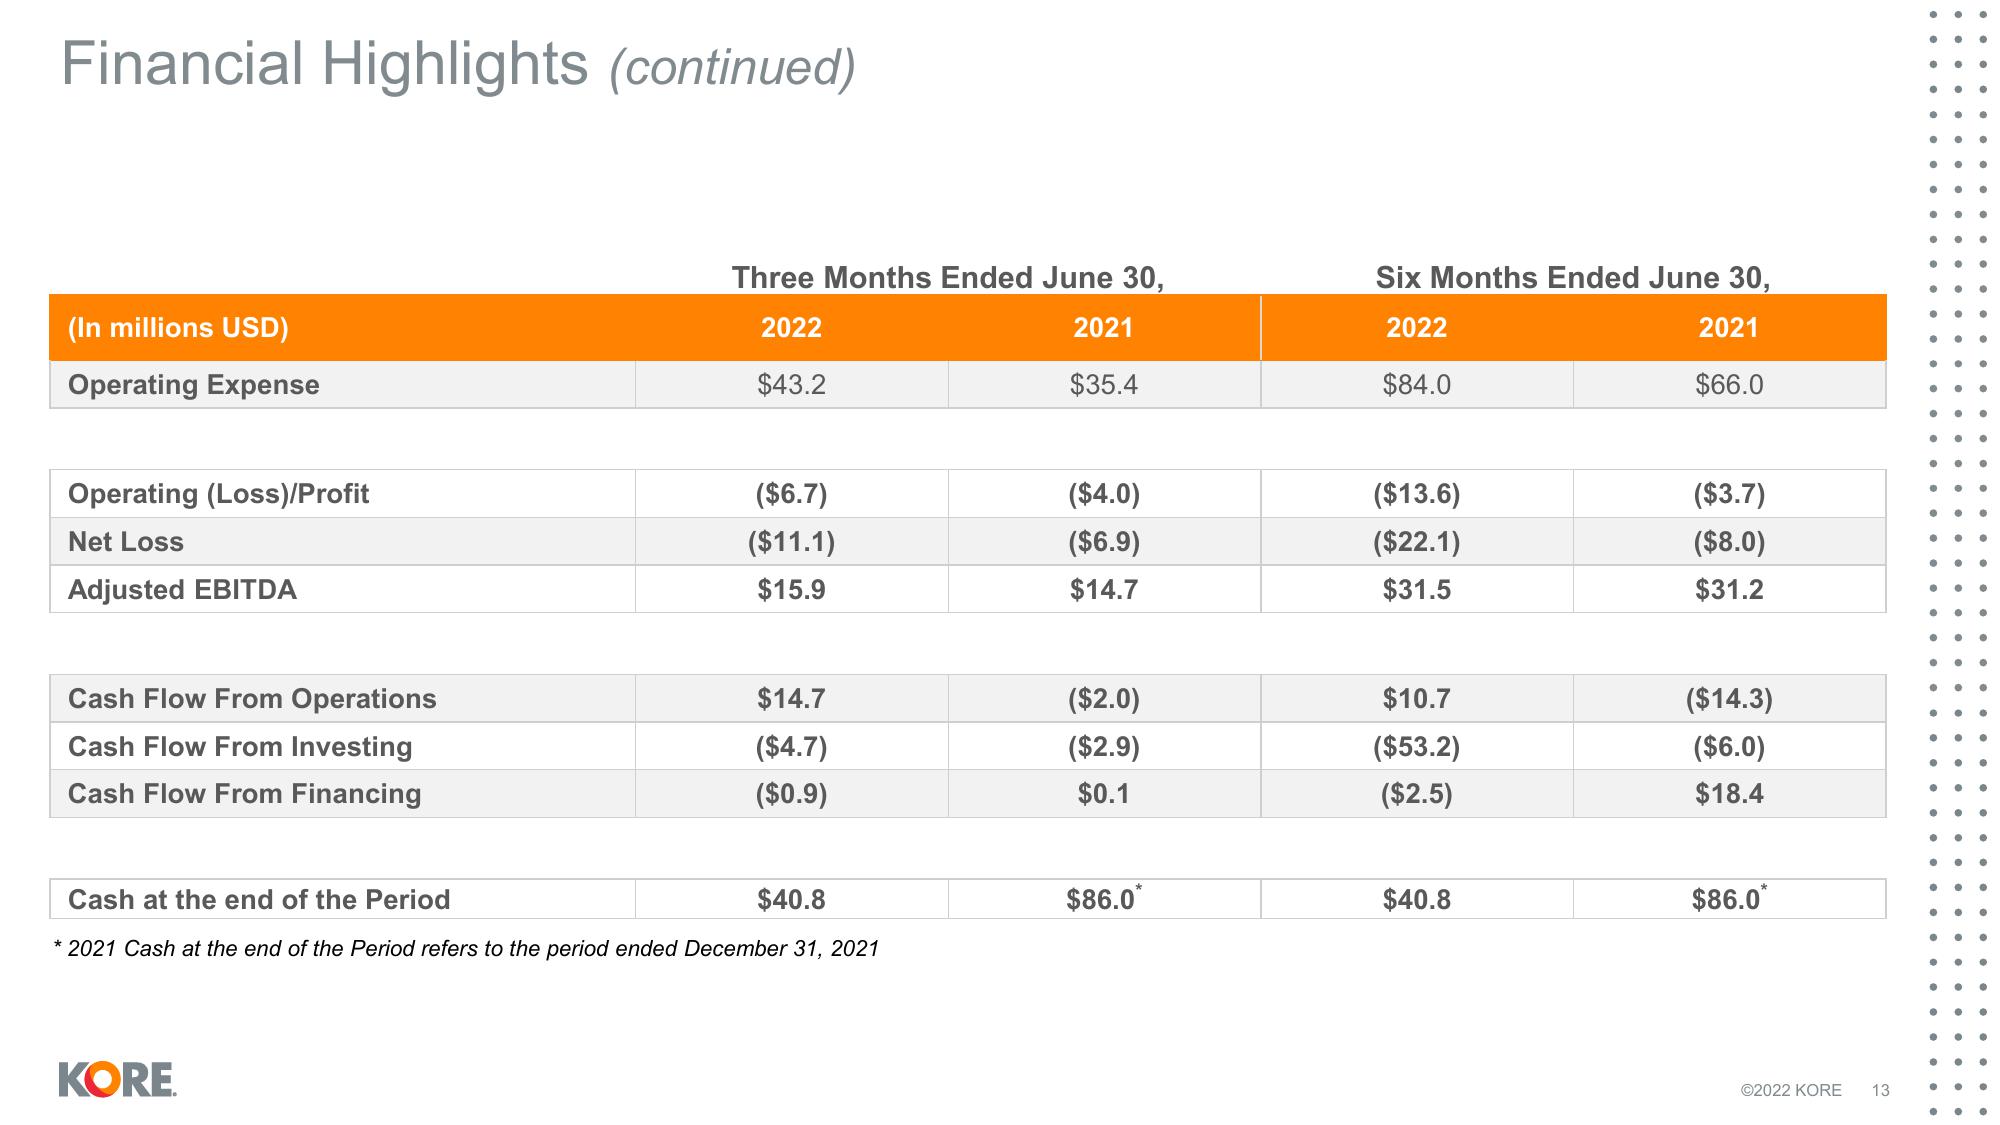
Financial Highlights (continued) (In millions USD) Operating Expense Operating (Loss)/Profit Net Loss Adjusted EBITDA Cash Flow From Operations Cash Flow From Investing Cash Flow From Financing Three Months Ended June 30, 2022 2021 $35.4 KORE $43.2 ($6.7) ($11.1) $15.9 $14.7 ($4.7) ($0.9) Cash at the end of the Period $40.8 * 2021 Cash at the end of the Period refers to the period ended December 31, 2021 ($4.0) ($6.9) $14.7 ($2.0) ($2.9) $0.1 $86.0* Six Months Ended June 30, 2022 2021 $66.0 $84.0 ($13.6) ($22.1) $31.5 $10.7 ($53.2) ($2.5) $40.8 ($3.7) ($8.0) $31.2 ($14.3) ($6.0) $18.4 $86.0* Ⓒ2022 KORE 13 ● ● ● ● ● • ● .. ● ● ● ● ● ● ● ● ● ● ● ● ● ● e • ● ● ● ● • ● • ● ● • e ● ● ● • ● ● ●
View entire presentation