Grab Results Presentation Deck
Q2 2021 Results
Consolidated group
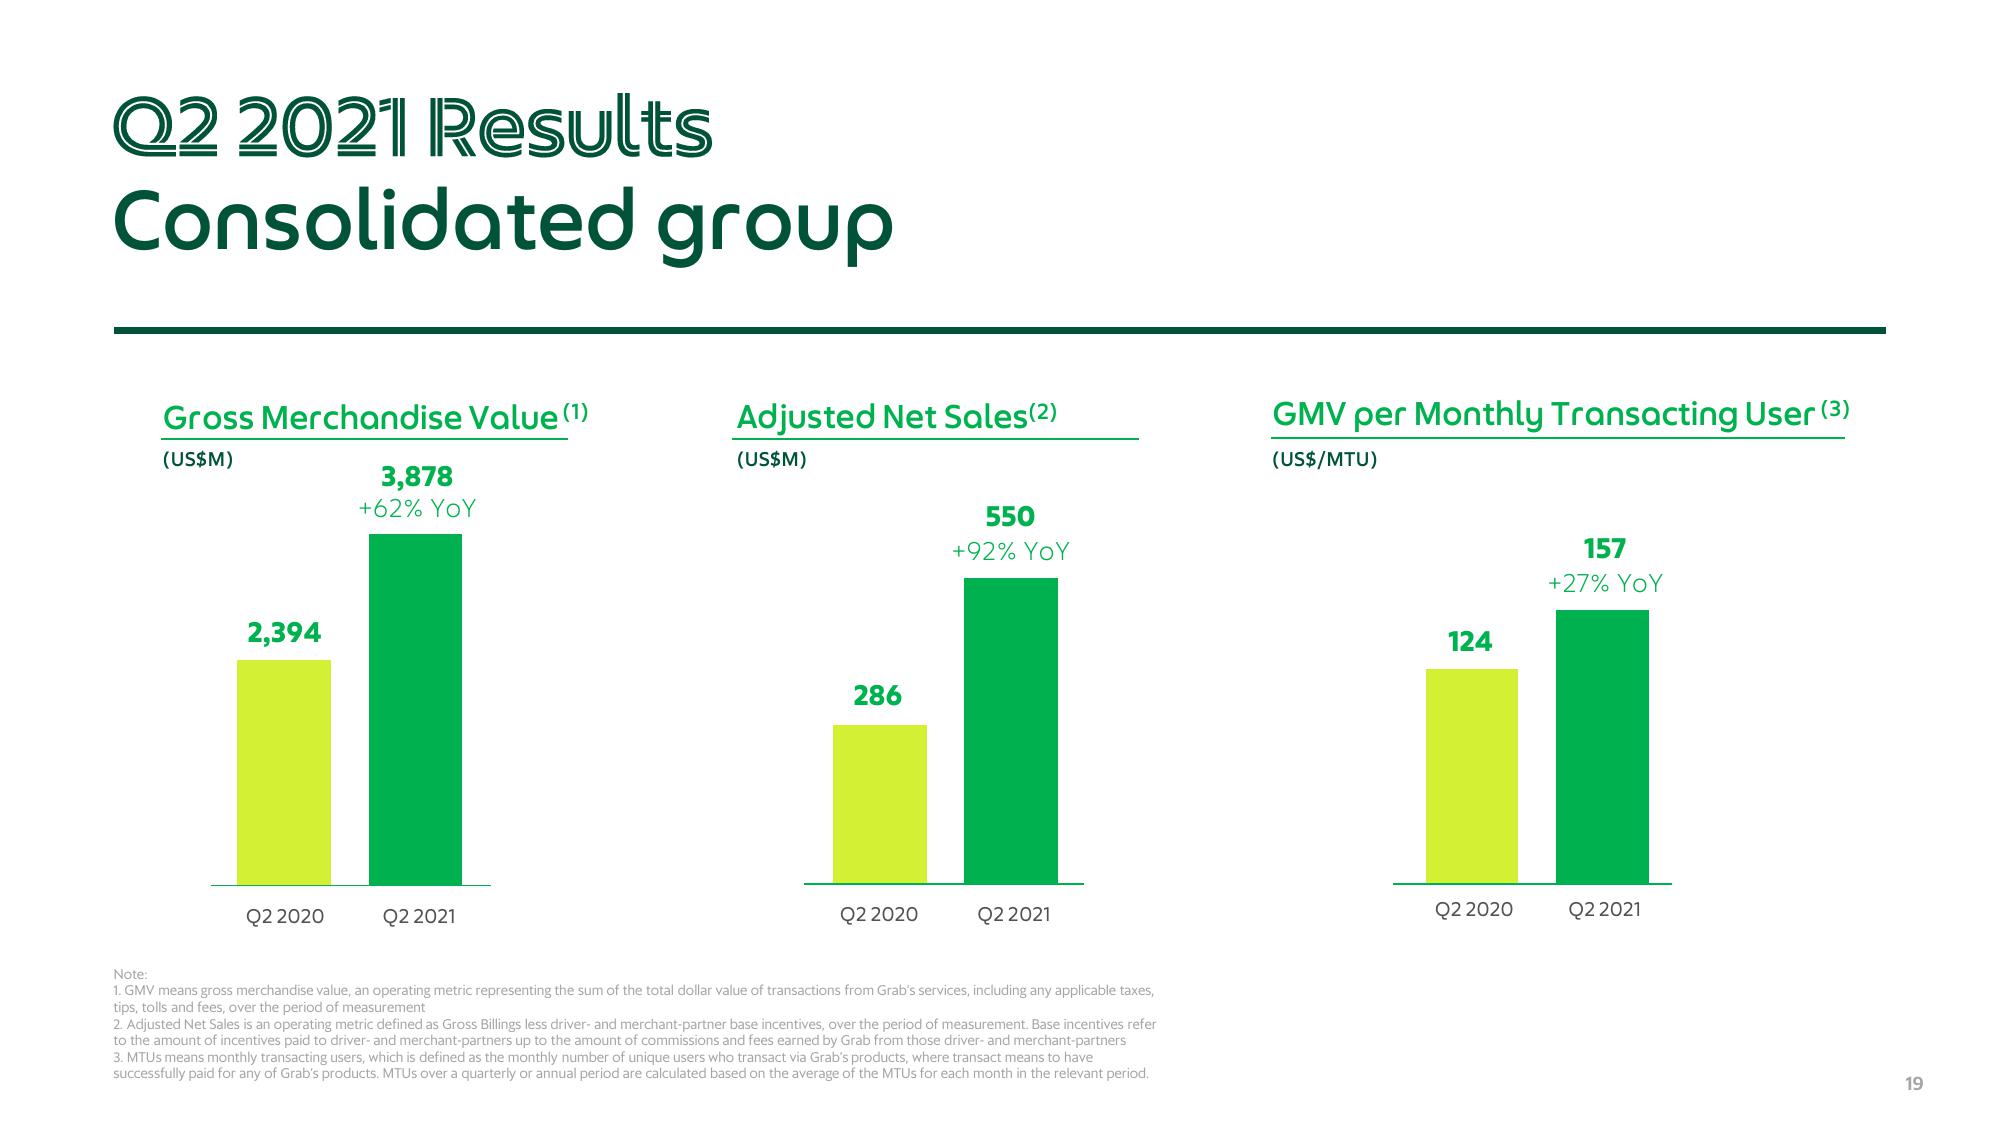
Gross Merchandise Value (1)
(US$M)
2,394
Q2 2020
3,878
+62% YOY
Q2 2021
Adjusted Net Sales (2)
(US$M)
286
Q2 2020
550
+92% YOY
Q2 2021
Note:
1. GMV means gross merchandise value, an operating metric representing the sum of the total dollar value of transactions from Grab's services, including any applicable taxes,
tips, tolls and fees, over the period of measurement
2. Adjusted Net Sales is an operating metric defined as Gross Billings less driver- and merchant-partner base incentives, over the period of measurement. Base incentives refer
to the amount of incentives paid to driver- and merchant-partners up to the amount of commissions and fees earned by Grab from those driver- and merchant-partners
3. MTUs means monthly transacting users, which is defined as the monthly number of unique users who transact via Grab's products, where transact means to have
successfully paid for any of Grab's products. MTUs over a quarterly or annual period are calculated based on the average of the MTUs for each month in the relevant period.
GMV per Monthly Transacting User (3)
(US$/MTU)
124
Q2 2020
157
+27% YOY
Q2 2021
19View entire presentation