Pershing Square Activist Presentation Deck
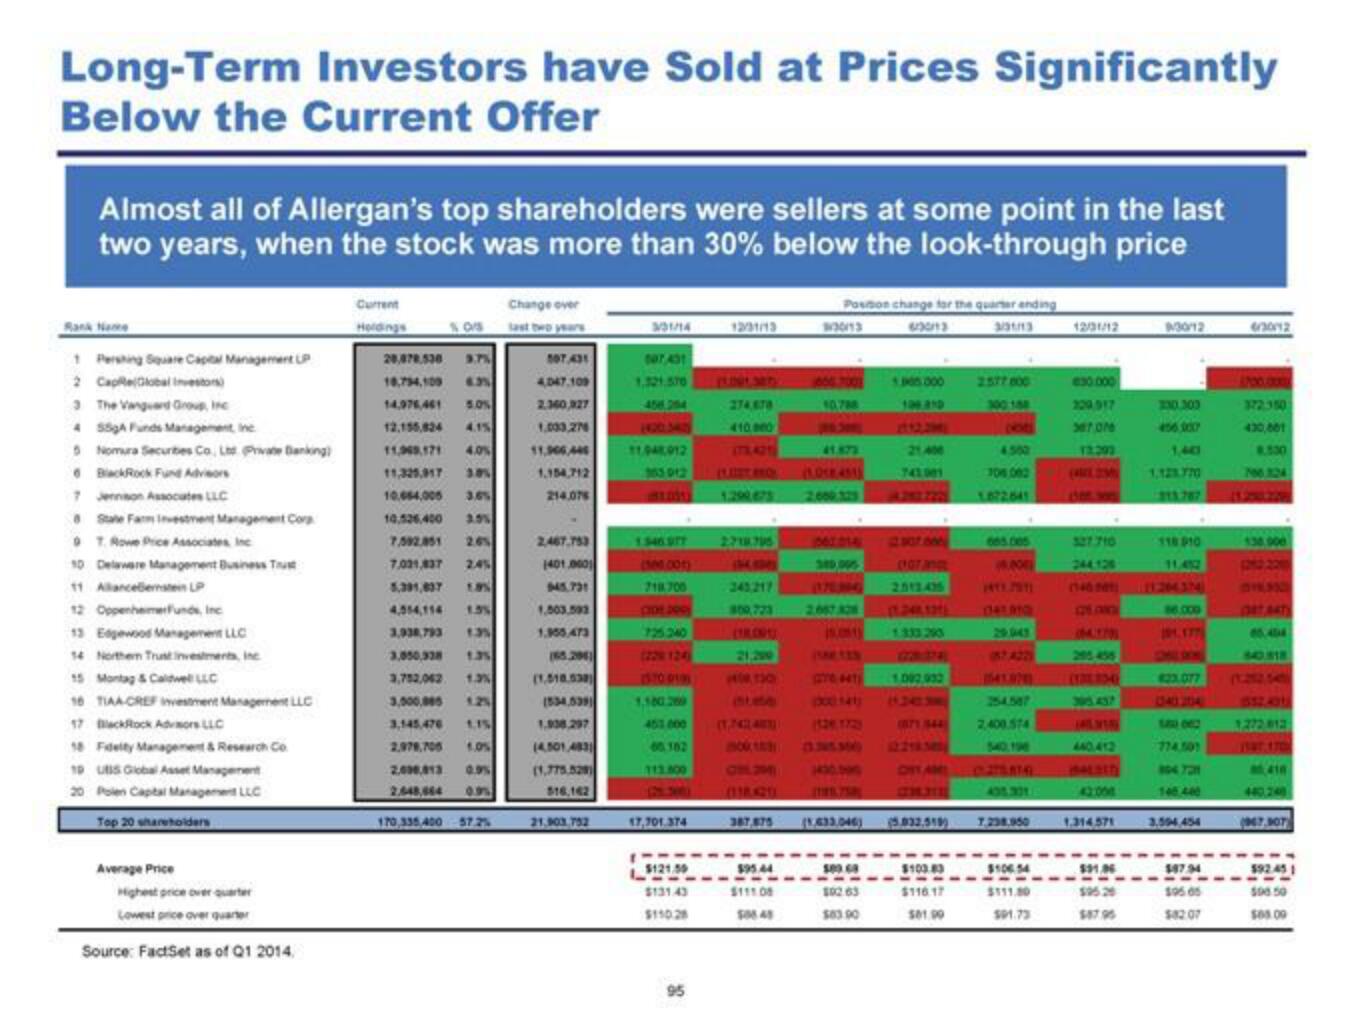
Long-Term Investors have Sold at Prices Significantly
Below the Current Offer
Almost all of Allergan's top shareholders were sellers at some point in the last
two years, when the stock was more than 30% below the look-through price
1 Pershing Square Capital Management P
2 Cape Global Investors)
3 The Vanguard Group, Inc
4 55gA Funds Management, inc
5 Nomura Securities Co., Ltd Private Banking)
6 BlackRock Fund Advisors
7 Jenson Associates LLC
8 State Farm Investment Management Corp
9 T. Rowe Price Associates, Inc
10 Delaware Management Business Trust
11 Allancebenstein LP
12 OppenheimerFunds, Inc
13 Edgewood Management LLC
14 Northern Trust investments, inc
15 Montag & Caldwell LLC
16 TIAA CREF investment Management LLC
17 BlackRock Advisors LLC
18 Fidelity Management & Research Co
19 UBS Global Asset Management
20 Polen Capital Management LLC
Top 20 shareholders
Average Price
Highest price over quarter
Lowest price over quarter
Source: FactSet as of Q1 2014.
Current
Change over
SOS last two years
20,878.530 3.7%
18,794,109 E
14,976,461 5.0%
12,155,824
11,949.171 4.0%
11,325,917 3.81
10.654,005 3.6%
10,526.400 3.5%
7.592.851 2.65
7,031,837 2.45
5,391,637 US
4,554,114 1.3%
3.938.793 1.35
3,050,338 1.35
3,752,042 1.3%
3,000,005
1.25
3,145,476 1.15
2.979,705 1.0%
2.000,013 0.9%
2.648,064
170,335,400 57.2%
4,047.109
2.360,327
1,003,276
11,906,446
1.154,712
214.075
2,467,753
1401.000
945.731
1,503.593
1.955,473
(65.294)
(1,018.538)
(534,539)
1,938,297
(4.501,483)
(1,775.529)
$16,162
21.903.752
3/31/14
107 401
1,321.570
456,284
11,948012
363 012
1.546 STF
(MM0.005)
718.700
1,180 209
453 000
60.302
113.800
17,701 374
$121.50
$131.43
$110.28
12/31/13
95
274,878
410.000
1.290,675
2.718.795
21,299
(1,744)
387,875
$95.44
$111.08
50648
------
Position change for the quarter ending
6:3013
3/31/113
1/2013
1666.700
10.788
15.01)
70 441)
1.305.000
106.810
503.68
102.63
$83.90
21,400
741.001
1.002.032
(871 844)
(1.633.046) (5.832.518)
$103.83
$116.17
$81.90
2577 800
4500
306 002
1.872641
665.ces
1.800
1411.7911
(141 910)
29.043
1541.92
254.587
2,400.574
401.301
7.298.950
$106.54
$111.80
501.73
12/31/12
830.000
309,917
367 076
(42M
327.710
(4.320
42:00
1.314.571
$31,06
$95.29
8/30/12
3:30.303
1,40
1,121.770
315.787
118 910
86.000
91.377
623.077
114.501
8047211
3.594,454
$47.34
$9505
$82.07
372-350
430,001
8.530
706.324
138.000
016350
86.404
1272 812
410
(9467.907
192.45 1
506 50
505.00View entire presentation